USD/MXN dives to new YTD lows as MXN buyers dominate the session on US holiday
- USD/MXN falls to fresh YTD lows of 17.0156, with MXN benefiting from thin trading volumes due to US Independence Day celebrations.
- Despite robust US data – including firm Durable Good Orders, Consumer Confidence, and Q1 GDP reports – a weaker-than-expected inflation report and ISM Manufacturing PMI dampen greenback appeal.
- Mexican economic indicators show promise, with improving business activity and record-breaking remittances;
- Banxico's private poll suggests a USD/MXN exchange rate of around 18.33 by year-end.

USD/MXN tumbles to fresh year-to-date (YTD) lows of 17.0156, as Mexican Peso (MXN) bulls take advantage of thin volumes as traders in the United States (US) remain absent on observance of Independence Day. The USD/MXN is trading at 17.0196, losses 0.23% after hitting a daily high n the overnight session of 17.0623.
Risk appetite and sturdy US economic data overwhelmed by weak inflation report, pushing USD/MXN lower
A risk-on mood keeps investors buying the emerging market currency; hence the USD/MXN is pressured. Tuesday’s lack of economic releases keeps USD/MXN traders leaning into the latest US economic releases, which painted an uncertain economic outlook in the US. Solid than-expected data, with Durable Good Orders exceeding estimates, an Improvement in Consumer Confidence, and an outstanding Gross Domestic Product (GDP) report for Q1, showed the US economy’s resilience. Solid housing data further supported that, while the Federal Reserve (Fed) Chair Jerome Powell emphasized the US central bank foresees at least two additional rate increases.
However, last Friday’s inflation report, the PCE and Core PCE sought by the Fed as its preferred gauge for inflation, edging lower, and a weak ISM Manufacturing PMI for June, pressured the greenback, as traders speculations for two rate increases, diminished.
The US Dollar Index (DXY), which tracks the buck’s value against a basket of six currencies, regained positive territory, up at 103.012, gains 0.04%.
On the Mexican front, the latest jobs report in Mexico was shrugged off by the Mexican Peso, as the USD/MXN pair threatened to break support at 17.00. In the meantime, business activity improved, as shown by the S&P Global Manufacturing PMI, at 50.90, exceeding May’s 50.50.
The latest tranche of data from Mexico showed that remittances broke a monthly record, while a Bank of Mexico (Banxico) private poll showed an upward revision by most private analysts, the USD/MXN exchange rate will end the year at around 18.33.
USD/MXN Price Analysis: Technical outlook
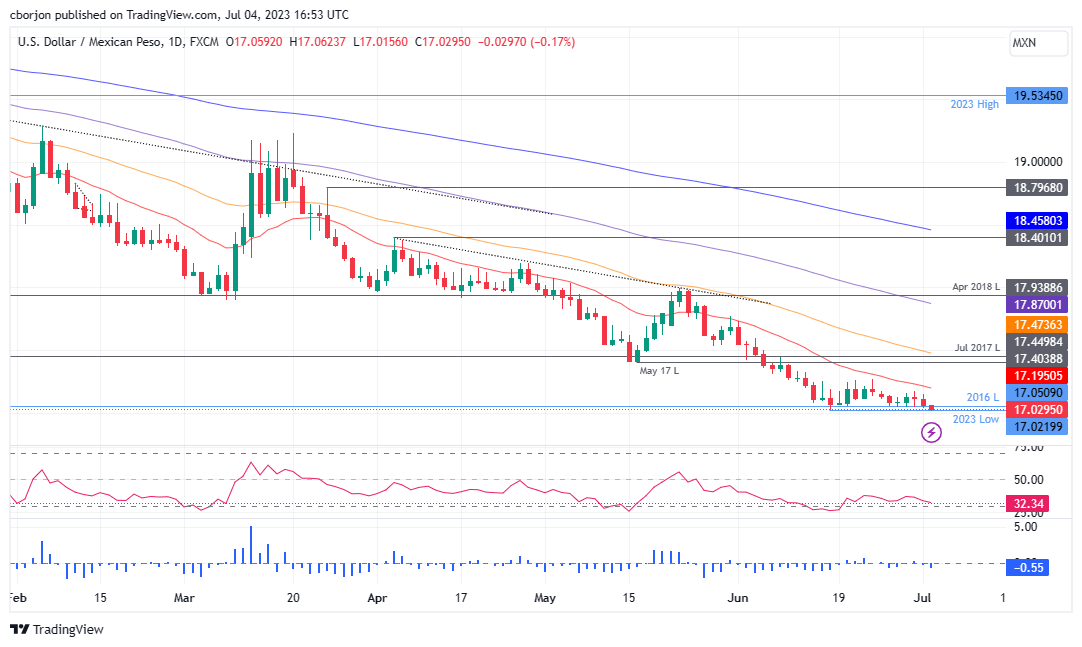
From a technical perspective, the USD/MXN remains neutral to downward biased, threatening to extend its losses below the psychological 17.00 figure. In that event, the following support levels would emerge at the 16.50 area, followed by the October 2015 low of 16.3267, and then the 16.00 figure. Conversely, the USD/MXN must reclaim the 20-day Exponential Moving Average (EMA) at 17.1942 to have a chance to turn bullish. Yet, after conquering the 20-day EMA, the next resistance would be the May 17 swing low at 17.4038. A breach of the latter could turn the pair neutral bullish and pave the way for further upside.
Author

Christian Borjon Valencia
FXStreet
Markets analyst, news editor, and trading instructor with over 14 years of experience across FX, commodities, US equity indices, and global macro markets.

















