USD/MXN bounces back on disappointing US data, CPI slows in Mexico
- USD/MXN gains ground as US Jobless Claims soar, Mexican inflation dips.
- Speculation of Banxico pausing tightening cycle boosts USD/MXN advance.
- Market eyeing US inflation data release, FOMC meeting amid global rate decision woes.

After falling to seven-year lows on Wednesday, the USD/MXN staged a comeback on Thursday, though it could be short-lived as the Asian session begins. The USD/MXN is trading at 17.3633, down 0.09%, after finishing Thursday’s session positive, with modest gains of 0.12%.
Peso-Dollar pair reacts as inflation cools down in Mexico
Wall Street closed the session with solid gains. The USD/MXN advanced on data from both countries, which underpinned the pair, as inflation in Mexico dipped below estimates. According to the Instituto Nacional de Estadistica, Geografia e Informatica (INEGI), the Consumer Price Index (CPI) in May fell -0.22% MoM, well below estimates of -0.16%. Annually based, CPI fell below the prior’s month 6.29%, at 5.84%, beneath the consensus of 5.9%.
Across the border, the US Bureau of Labor Statistics (BLS) featured Initial Jobless Claims for the last week ending June 3 jumped 261K, up from 232K expected by analysts, the highest since October 2021. That adds to an outstanding Nonfarm Payrolls report last Friday, which showed the economy created 339K jobs, but the rise in the Unemployment Rate was a prelude to the previous week’s data.
Following both releases, the USD/MXN advanced from around the 17.3500 figure towards the daily high at 17.4426 on speculations of a pause of the Bank of Mexico (Banxico) tightening cycle. Regarding the US Federal Reserve (Fed), comments in the last week cemented the case for skipping raising rates in June and waiting for July.
However, the latest monetary policy decisions by the Reserve Bank of Australia (RBA) and the Bank of Canada (BoC) sparked concerns about what the Fed will do. Given that the RBA and the BoC kept rates on hold, inflation has resumed its upward path in some meetings. That triggered a reaction by both institutions.
Upcoming events
The US calendar is empty, with traders eyeing Tuesday, June 13, with the release of inflation data, alongside the beginning of the FOMC’s meeting.
USD/MXN Price Analysis: Technical outlook
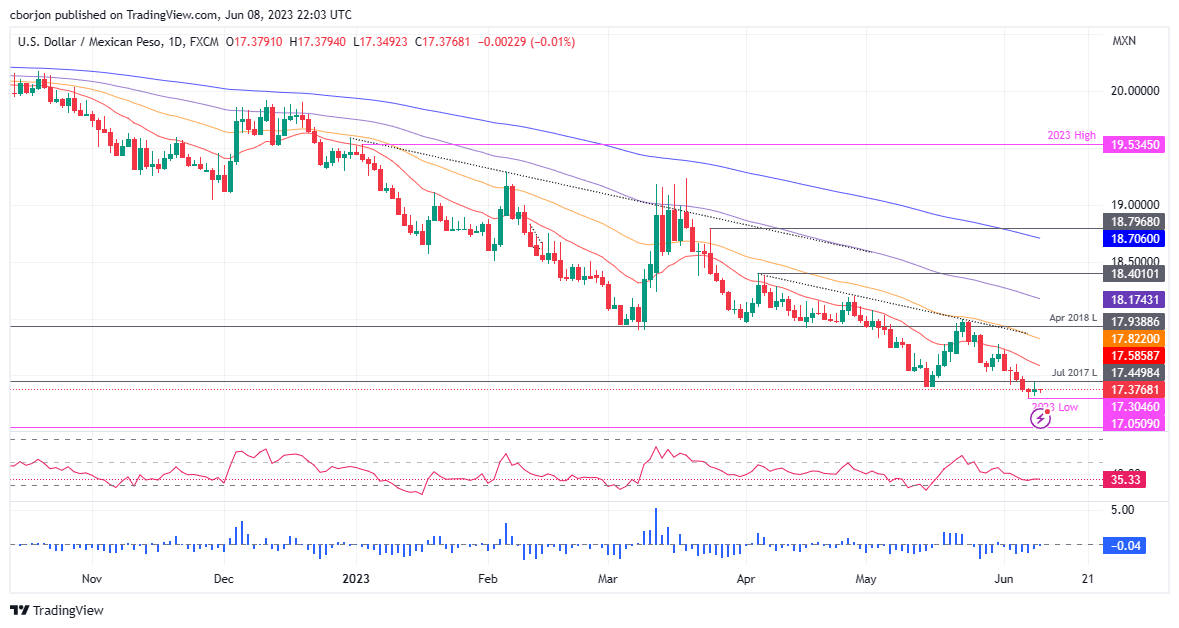
The daily chart portrays the USD/MXN pair as downward biased, though it appears to be bottoming. Although that has been commented on in previous articles, it should be taken cautiously. A double bottom could be forming, but it would need to claim two daily EMAs, the 20 and 50-day period, each at 17.5851 and 17.8217, before challenging resistance at a May 23 high of 17.99. Once cleared, the following supply area to test would be the 100-day EMA at 18.1741. Conversely, the pair could continue printing new multi-year lows below the current YTD low at 17.30.
Author

Christian Borjon Valencia
FXStreet
Christian Borjon began his career as a retail trader in 2010, mainly focused on technical analysis and strategies around it. He started as a swing trader, as he used to work in another industry unrelated to the financial markets.


