|

USD/JPY technical analysis: The Greenback might be heading towards the 110.00 handle

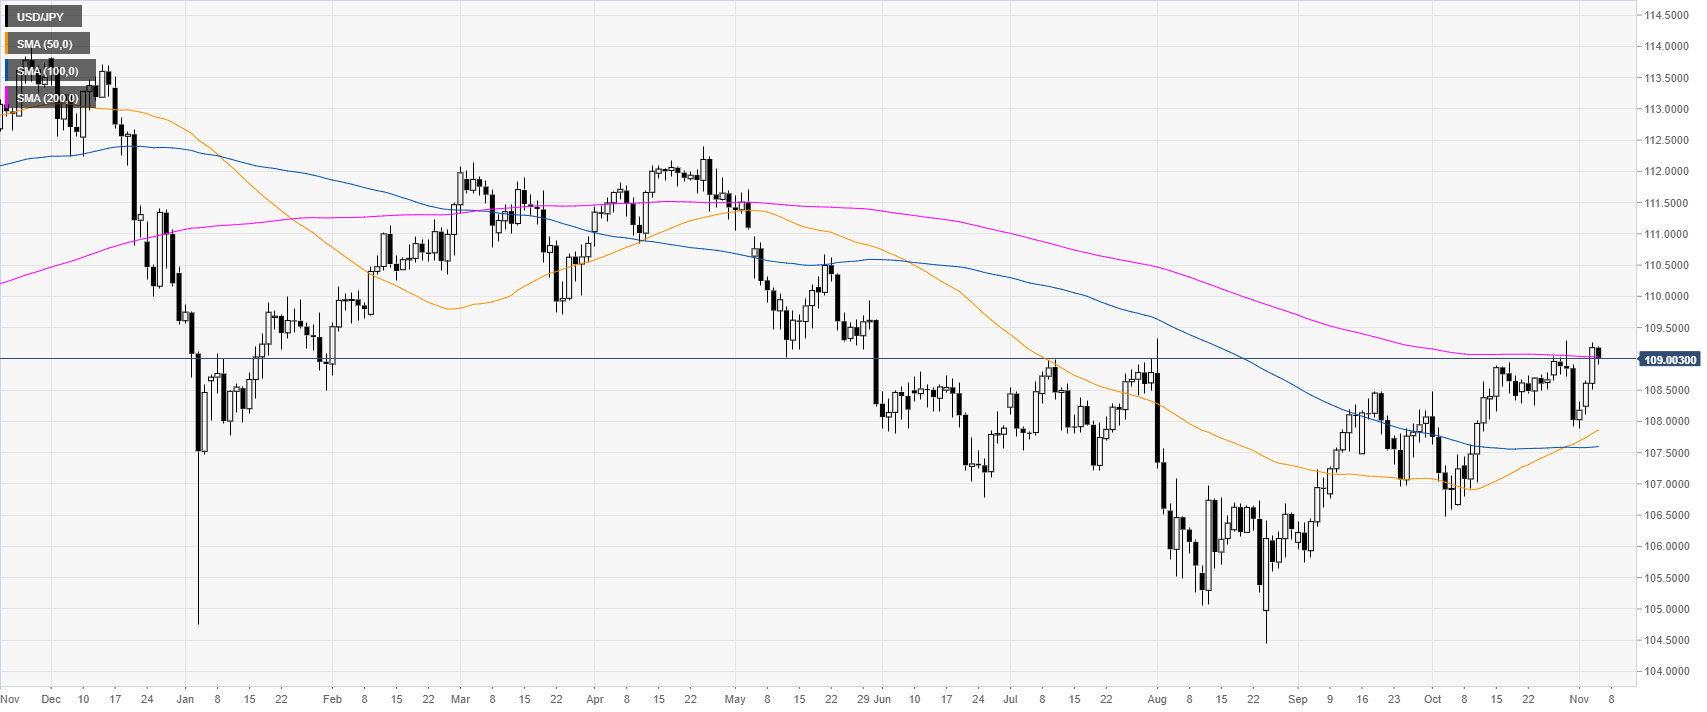
  • USD/JPY is challenging the 109.00 handle and the 200 DMA. 
  • The level to beat for buyers is the 109.29 resistance.


USD/JPY daily chart

 
USD/JPY is challenging the 109.00 handle and the 200-day simple moving average (SMA) on the daily chart. In both September and October, the market has been consistently gaining strength.  
 

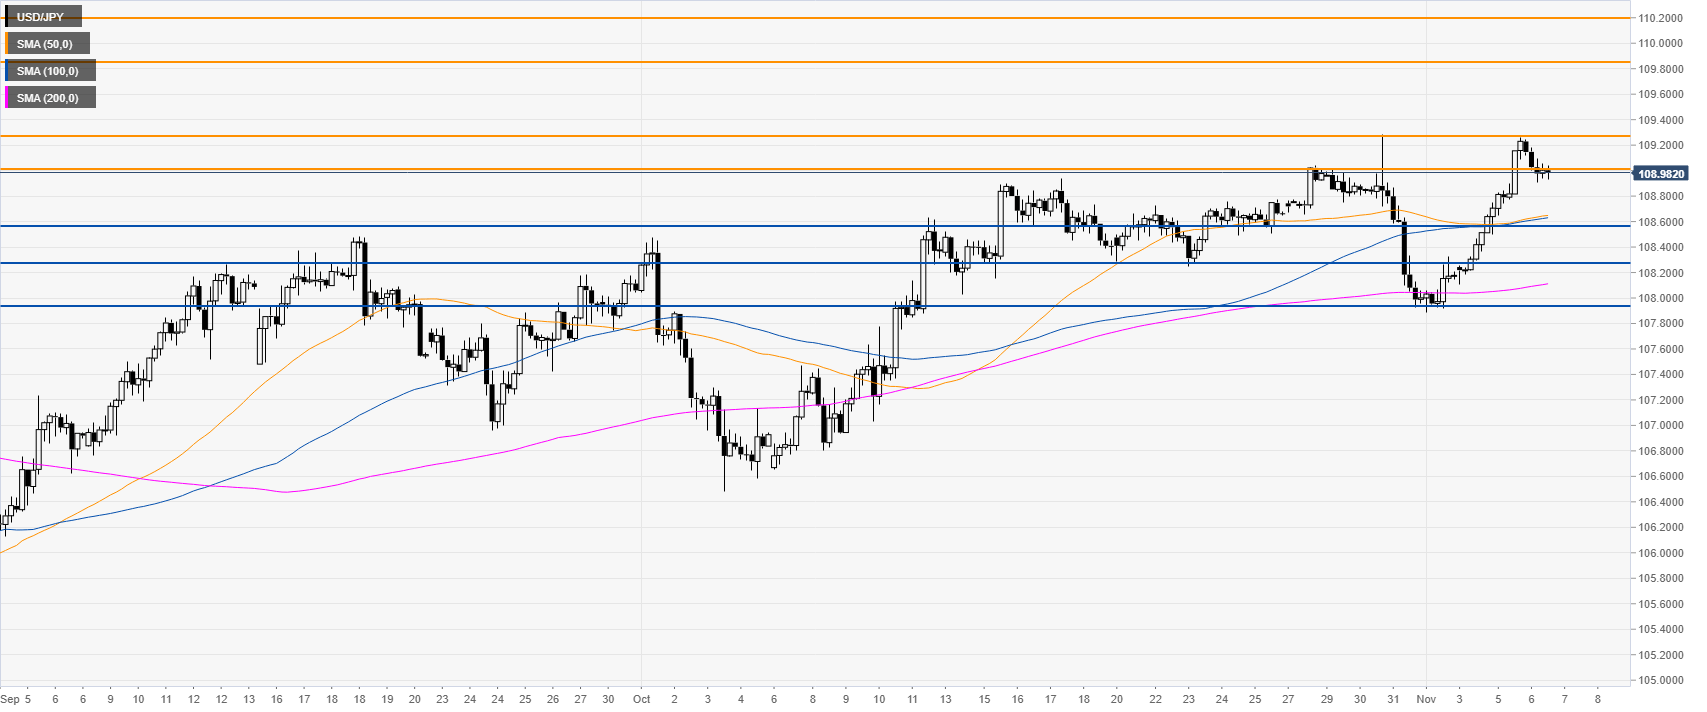
USD/JPY four-hour chart

 
USD/JPY is trading above its main SMAs on the four-hour chart, suggesting a bullish momentum in the medium term. Bulls want to overcome the 109.29 resistance to extend the bullish leg towards the 109.85 and 110.20 price levels, according to the Technical Confluences Indicator. 
 

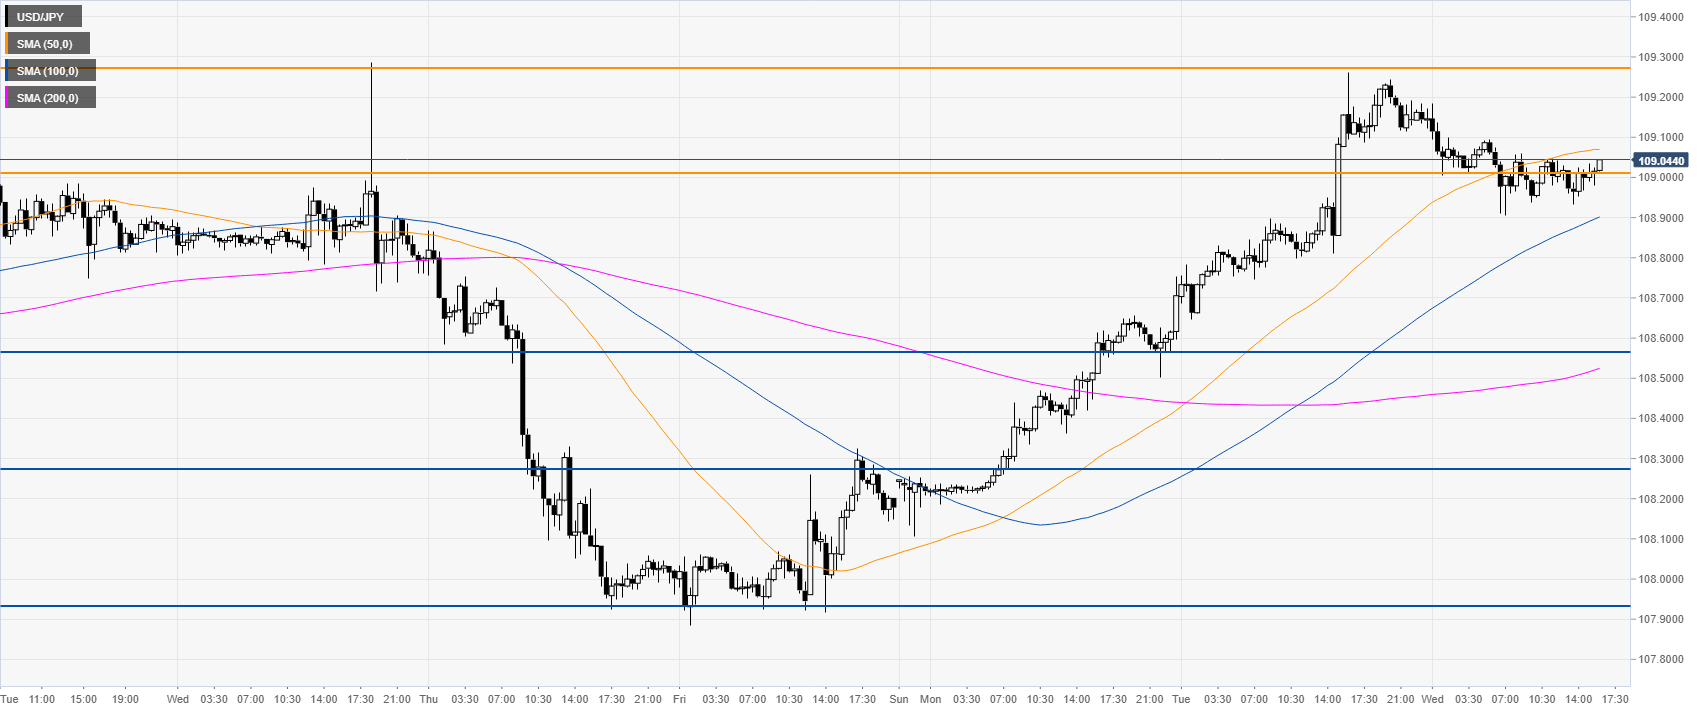
USD/JPY 30-minute chart

 
USD/JPY is trading above the upward sloping 100 and 200 SMA, suggesting a bullish bias in the near term. Support is seen at the 109.00 figure followed by the 108.55 and 108.27 levels, according to the Technical Confluences Indicator. 
 

Additional key levels

USD/JPY

Overview
Today last price109.02
Today Daily Change-0.16
Today Daily Change %-0.15
Today daily open109.18
 
Trends
Daily SMA20108.53
Daily SMA50107.81
Daily SMA100107.59
Daily SMA200109.03
 
Levels
Previous Daily High109.26
Previous Daily Low108.5
Previous Weekly High109.29
Previous Weekly Low107.89
Previous Monthly High109.29
Previous Monthly Low106.48
Daily Fibonacci 38.2%108.97
Daily Fibonacci 61.8%108.79
Daily Pivot Point S1108.7
Daily Pivot Point S2108.22
Daily Pivot Point S3107.94
Daily Pivot Point R1109.46
Daily Pivot Point R2109.74
Daily Pivot Point R3110.22

Author

Flavio Tosti

Flavio Tosti

Independent Analyst


More from Flavio Tosti
Share:

Editor's Picks

EUR/USD flirts with daily highs, retargets 1.1900

EUR/USD regains upside traction, returning to the 1.1880 zone and refocusing its attention to the key 1.1900 barrier. The pair’s slight gains comes against the backdrop of a humble decline in the US Dollar as investors continue to assess the latest US CPI readings and the potential Fed’s rate path.

GBP/USD remains well bid around 1.3650

GBP/USD maintains its upside momentum in place, hovering around daily highs near 1.3650 and setting aside part of the recent three-day drop. Cable’s improved sentiment comes on the back of the Greenback’s  irresolute price action, while recent hawkish comments from the BoE’s Pill also collaborate with the uptick.

Gold clings to gains just above $5,000/oz

Gold is reclaiming part of the ground lost on Wednesday’s marked decline, as bargain-hunters keep piling up and lifting prices past the key $5,000 per troy ounce. The precious metal’s move higher is also underpinned by the slight pullback in the US Dollar and declining US Treasury yields across the curve.

Crypto Today: Bitcoin, Ethereum, XRP in choppy price action, weighed down by falling institutional interest 

Bitcoin's upside remains largely constrained amid weak technicals and declining institutional interest. Ethereum trades sideways above $1,900 support with the upside capped below $2,000 amid ETF outflows.

Week ahead – Data blitz, Fed Minutes and RBNZ decision in the spotlight

US GDP and PCE inflation are main highlights, plus the Fed minutes. UK and Japan have busy calendars too with focus on CPI. Flash PMIs for February will also be doing the rounds. RBNZ meets, is unlikely to follow RBA’s hawkish path.

Ripple Price Forecast: XRP potential bottom could be in sight

Ripple edges up above the intraday low of $1.35 at the time of writing on Friday amid mixed price actions across the crypto market. The remittance token failed to hold support at $1.40 the previous day, reflecting risk-off sentiment amid a decline in retail and institutional sentiment.