|

USD/JPY technical analysis: Rises above 200-HMA, RSI favors further gains

  • USD/JPY is printing session highs above the 200-hour moving average (MA).
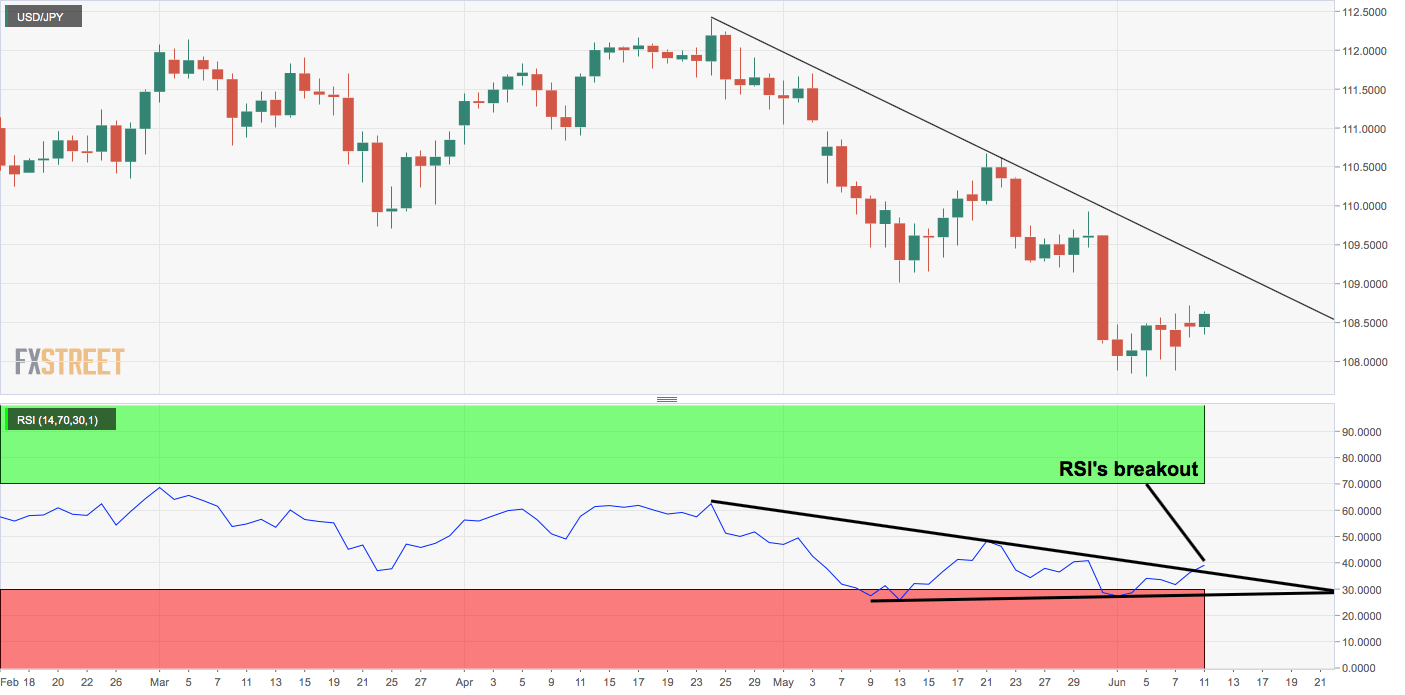
  • The 14-day RSI is reporting a descending channel breakout.

The USD/JPY pair is solidly bid at press time amid risk-on action in the Asian equity markets.

The currency pair is currently trading at 108.63 and is sitting well above the 200-hour moving average (MA) of 108.53.

The gains could be extended further toward the daily chart falling channel resistance, currently at 109.35, as the 14-day relative strength index (RSI) is now breaking higher from the descending triangle, having charted a bullish divergence (higher lows) in early June.

The bullish case, however, would weaken if the spot finds acceptance below Monday’s low of 108.31.

Daily chart

Trend: Bullish

Pivot points

    1. R3 109.08
    2. R2 108.9
    3. R1 108.67
  1. PP 108.49
    1. S1 108.27
    2. S2 108.08
    3. S3 107.86

Author

Omkar Godbole

Omkar Godbole

FXStreet Contributor

Omkar Godbole, editor and analyst, joined FXStreet after four years as a research analyst at several Indian brokerage companies.

More from Omkar Godbole
Share:

Editor's Picks

EUR/USD holds above 1.1750 after mixed EU PMI data

EUR/USD manages to hold above 1.1750 but struggles to gather recovery momentum on Friday, following the mixed February PMI figures from Germany and the Eurozone. In the second half of the day, Q4 GDP, December inflation and February PMI data from the US will be watched closely by market participants.

GBP/USD recovers further toward 1.3500 after UK PMI data

GBP/USD is recovering ground further toward 1.3500 in European trading on Friday, helped by a modest uptick in the Pound Sterling after stronger-than-expected UK January Retail Sales and February PMI data. However, the pair's further upside could be limited amid persistent US Dollar strength as the focus turns to key US data. 

Gold sticks to positive bias above $5,000 ahead of US data

Gold gains some positive traction for the third consecutive day on Friday. holding above $5,000. Traders now look forward to the key US macro releases – the Advance Q4 GDP report and the Personal Consumption Expenditures (PCE) Price Index – for fresh trading impetus. 

US GDP growth expected to slow down significantly in Q4 after stellar Q3 

The United States Bureau of Economic Analysis will publish the first preliminary estimate of the fourth-quarter Gross Domestic Product at 13:30 GMT. Analysts forecast the US economy to have expanded at a 3% annualized rate, slowing down from the 4.4% growth posted in the previous quarter.

Iran tensions and AI fears at the forefront ahead of key US data

Thursday’s scorecard shows major US Stock benchmarks closed modestly in the red amid mounting US-Iran tensions and AI disruption worries. The S&P 500 shed 19 points (0.3%) to 6,861, the Nasdaq 100 lost 101 points (0.4%) to 24,797, and the Dow Jones Industrial Average dropped 267 points (0.5%) to 49,395.

Official Trump price approaches breakout with mixed signals from traders

Official Trump (TRUMP) is trading at $3.50 at the time of writing, approaching its upper consolidation range. A breakout from this range could open the door for an upside move. On-chain data shows market indecision, with balanced flows between bulls and bears, signaling a lack of clear directional bias.