|

USD/JPY technical analysis: Rebounds from daily lows, lots of resistance ahead

  • USD/JPY is under bearish pressure at multi-month lows. 
  • Bulls are attempting a rebound, but there is a lot of resistance to be overcome. 
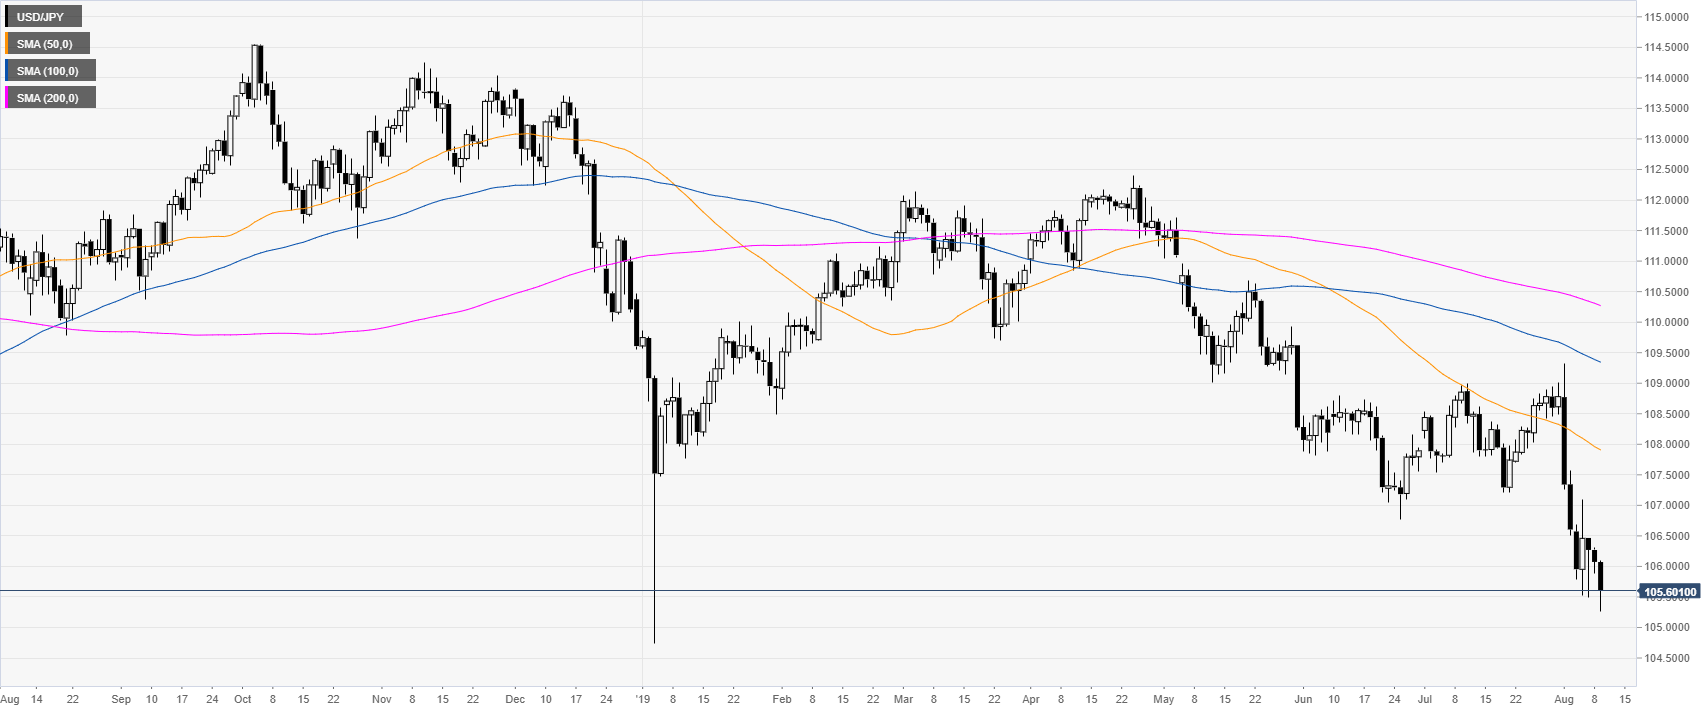
 

USD/JPY daily chart


USD/JPY is off multi-month lows while trading well below its main daily simple moving averages (DSMAs). Trade war news and US yields mainly influence USD/JPY price action. 
 

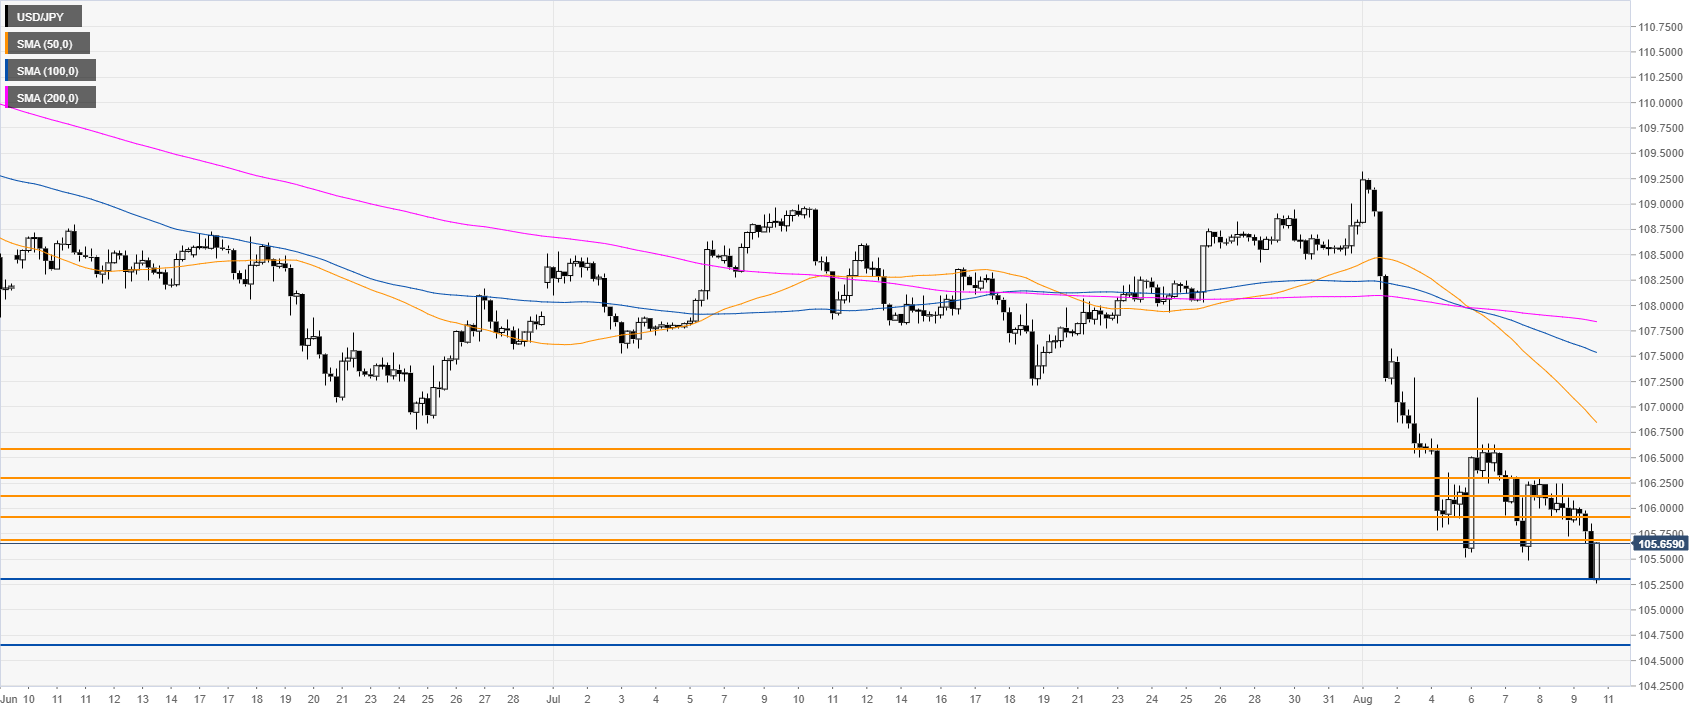
USD/JPY 4-hour chart

 
USD/JPY is rebounding from a critical support at the 105.30 level. A break below this level would likely open the doors to a significant move down towards 104.65, according to the Technical Confluences Indicator.
 

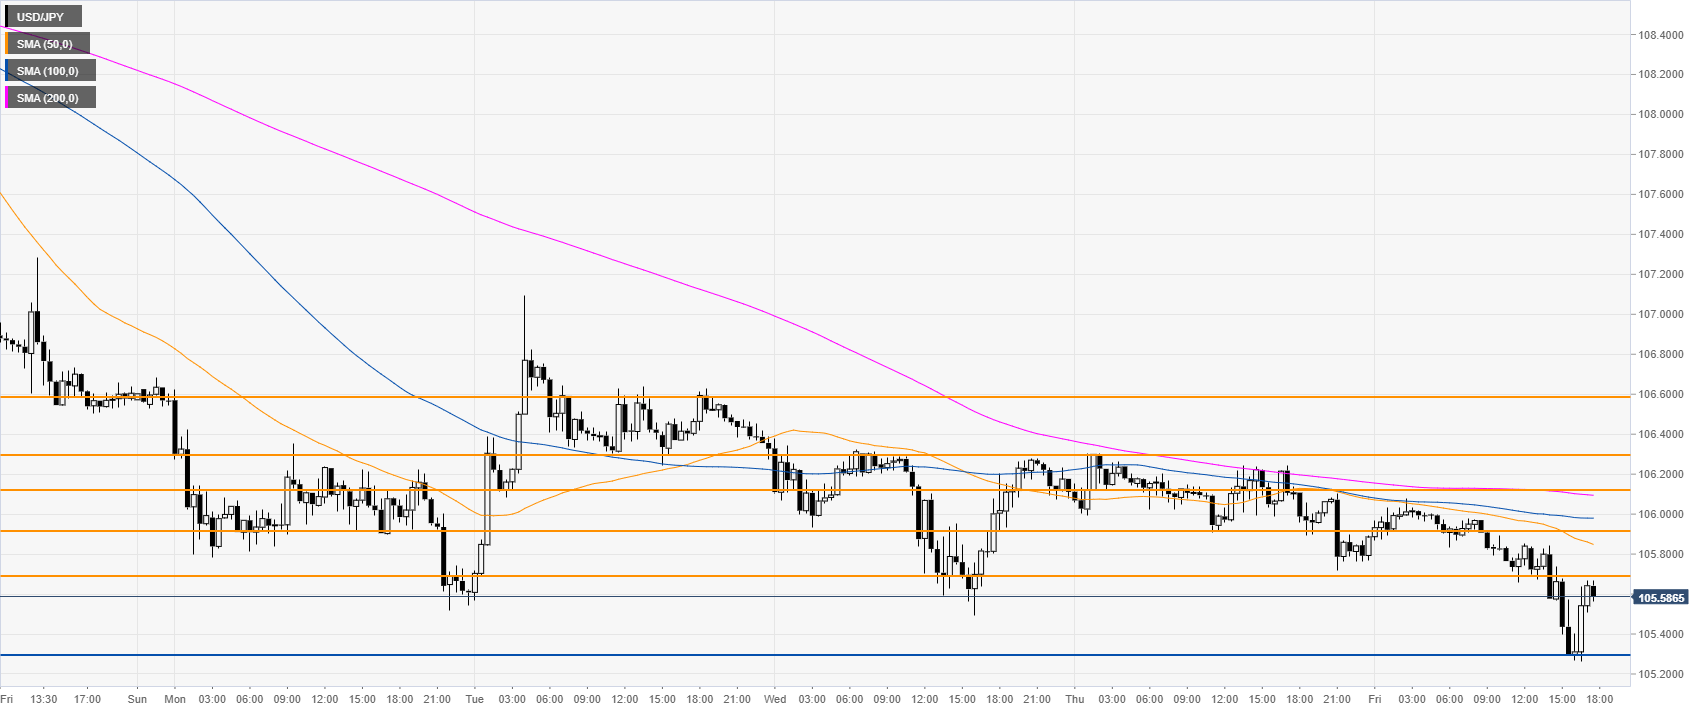
USD/JPY 30-minute chart

 
Bulls are attempting to create some traction but they have a lot of resistance to overcome if they want to get out of the woods. The 105.69 resistance followed by 105.91 and 106.13 need to be taken out. After which 106.30 and 106.57 resistances can come into play, according to the Technical Confluences Indicator. 


Additional key levels

USD/JPY

Overview
Today last price105.64
Today Daily Change-0.43
Today Daily Change %-0.41
Today daily open106.07
 
Trends
Daily SMA20107.67
Daily SMA50107.96
Daily SMA100109.39
Daily SMA200110.31
Levels
Previous Daily High106.3
Previous Daily Low105.89
Previous Weekly High109.32
Previous Weekly Low106.5
Previous Monthly High109.01
Previous Monthly Low107.21
Daily Fibonacci 38.2%106.05
Daily Fibonacci 61.8%106.15
Daily Pivot Point S1105.88
Daily Pivot Point S2105.68
Daily Pivot Point S3105.46
Daily Pivot Point R1106.29
Daily Pivot Point R2106.5
Daily Pivot Point R3106.7

Author

Flavio Tosti

Flavio Tosti

Independent Analyst


More from Flavio Tosti
Share:

Editor's Picks

EUR/USD: US Dollar comeback in the makes?

The US Dollar stands victorious at the end of another week, with the EUR/USD pair trading near a four-week low of 1.1742, while the USD retains its strength despite some discouraging American data released at the end of the week. The pair edged higher on Friday, after the United States Supreme Court ruled against President Donald Trump's tariffs, although the advance is not enough to change the latest USD flow.

GBP/USD braces for more pain, as 200-day SMA tested

GBP/USD broke the previous week’s consolidation to the downside, as sellers returned with pomp, smashing the major back toward the levels last seen in late January. The pair tested bids below the 1.3450 barrier as the US Dollar strength largely played out throughout the week, while the Pound Sterling stepped back on expectations of divergent monetary policy outlooks between the Bank of England and the US Federal Reserve.

Gold climbs to weekly tops, approaches $5,100/oz

Gold keeps the bid tone well in place at the end of the week, now hitting fresh weekly highs and retargeting the key $5,100 mark per troy ounce. The move higher in the yellow metal comes in response to ongoing geopolitical tensions in the Middle East and modest losses in the US Dollar.

Week ahead: Markets brace for heightened volatility as event risk dominates

Dollar strength dominates markets as risk appetite remains subdued. A Supreme Court ruling, geopolitics and Fed developments are in focus. Pivotal Nvidia earnings on Wednesday as investors question tech sector weakness. Yen and aussie diverge; both pound and euro could recoup their losses.

Broadening drivers of growth: Unpacking GDP and looking ahead

This week’s data delivered a familiar theme with an important twist. The U.S. economy continues to be shaped by powerful forces in high-tech and AI-related investment, but recent releases suggest the growth story may finally be broadening. At the same time, trade flows are moving in a less supportive direction, reminding us that not all parts of the economy are pulling in sync.

Ripple bulls defend key support amid waning retail demand and ETF inflows

XRP ticks up above $1.40 support, but waning retail demand suggests caution. XRP attracts $4 million in spot ETF inflows on Thursday, signaling renewed institutional investor interest.