|

USD/JPY Technical Analysis: Re-test of bullish 5-day EMA support likely

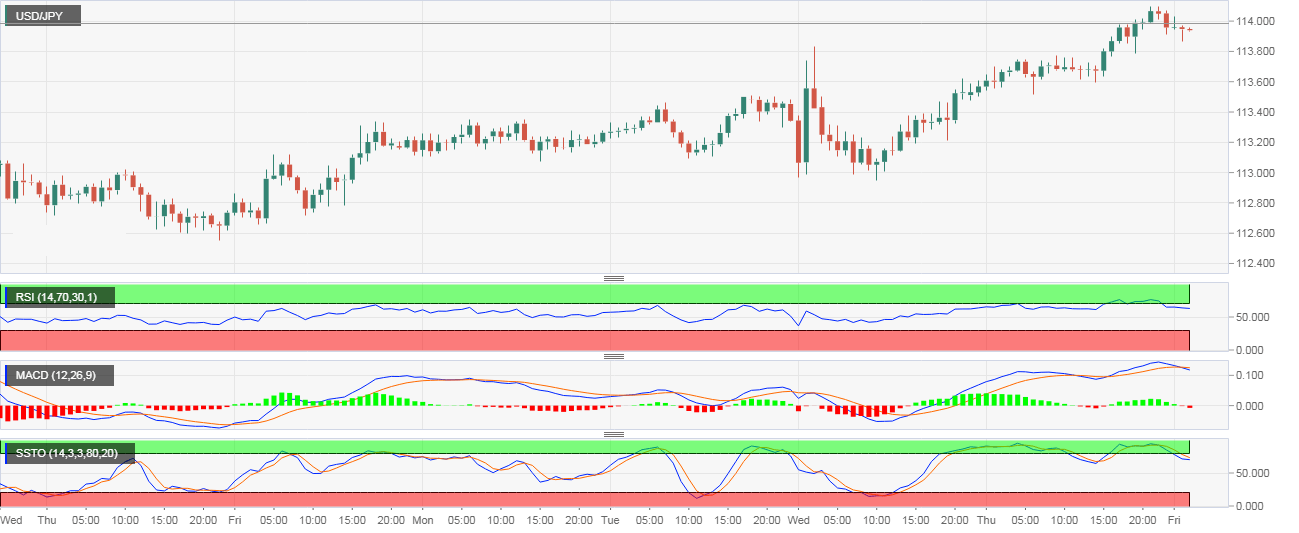
  • The USD/JPY is currently trading at 113.92, down 0.12 percent on the day, and could drop further to the 5-day exponential moving average (EMA) of 113.65 as the indicators on the hourly chart have rolled over in favor of the bears.
  • For instance, the hourly chart RSI is flashing a bearish divergence and has eroded the rising trendline. The stochastic has rolled over from the overbought territory and the MACD is producing a bearish crossover.
  • The pullbacks, however, could be short-lived as the pair closed yesterday above the previous day's high of 113.82, bolstering the already bullish setup on the daily chart:  higher lows and higher highs and ascending 5-, 10-, 50-day EMAs.

Hourly Chart

Trend: minor pullback likely before further gains

USD/JPY

Overview:
    Last Price: 113.88
    Daily change: -11 pips
    Daily change: -0.0965%
    Daily Open: 113.99
Trends:
    Daily SMA20: 112.7
    Daily SMA50: 112.53
    Daily SMA100: 111.83
    Daily SMA200: 110.02
Levels:
    Daily High: 114.02
    Daily Low: 113.48
    Weekly High: 113.4
    Weekly Low: 111.78
    Monthly High: 114.56
    Monthly Low: 111.38
    Daily Fibonacci 38.2%: 113.81
    Daily Fibonacci 61.8%: 113.68
    Daily Pivot Point S1: 113.64
    Daily Pivot Point S2: 113.28
    Daily Pivot Point S3: 113.09
    Daily Pivot Point R1: 114.18
    Daily Pivot Point R2: 114.37
    Daily Pivot Point R3: 114.73

Author

Omkar Godbole

Omkar Godbole

FXStreet Contributor

Omkar Godbole, editor and analyst, joined FXStreet after four years as a research analyst at several Indian brokerage companies.

More from Omkar Godbole
Share:

Editor's Picks

EUR/USD meets initial support around 1.1800

EUR/USD remains on the back foot, although it has managed to reverse the initial strong pullback toward the 1.1800 region and regain some balance, hovering around the 1.1850 zone as the NA session draws to a close on Tuesday. Moving forward, market participants will now shift their attention to the release of the FOMC Minutes and US hard data on Wednesday.
 

GBP/USD bounces off lows, retargets 1.3550

After bottoming out just below the 1.3500 yardstick, GBP/USD now gathers some fresh bids and advances to the 1.3530-1.3540 band in the latter part of Tuesday’s session. Cable’s recovery comes as the Greenback surrenders part of its advance, although it keeps the bullish bias well in place for the day.

Gold remains offered below $5,000

Gold stays on the defensive on Tuesday, receding to the sub-$5,000 region per troy ounce on the back of the persistent move higher in the Greenback. The precious metal’s decline is also underpinned by the modest uptick in US Treasury yields across the spectrum.

Ethereum Price Forecast: BitMine extends ETH buying streak, says long-term outlook remains positive

Ethereum (ETH) treasury firm BitMine Immersion continued its weekly purchase of the top altcoin last week after acquiring 45,759 ETH.

UK jobs market weakens, bolstering rate cut hopes

In the UK, the latest jobs report made for difficult reading. Nonetheless, this represents yet another reminder for the Bank of England that they need to act swiftly given the collapse in inflation expected over the coming months. 

Ripple slides to $1.45 as downside risks surge

Ripple edges lower at the time of writing on Tuesday, from the daily open of $1.48, as headwinds persist across the crypto market. A short-term support is emerging at $1.45, but a buildup of bearish positions could further weaken the derivatives market and prolong the correction.