USD/JPY Technical Analysis: Quick drop into 113.00 reveals firm support
- The Dollar-Yen pair is steeply off of this week's early levels, dropping into the 113.00 handle in early Tuesday action after slipping from Monday's range around the 113.50 zone.

USD/JPY, 5-Minute
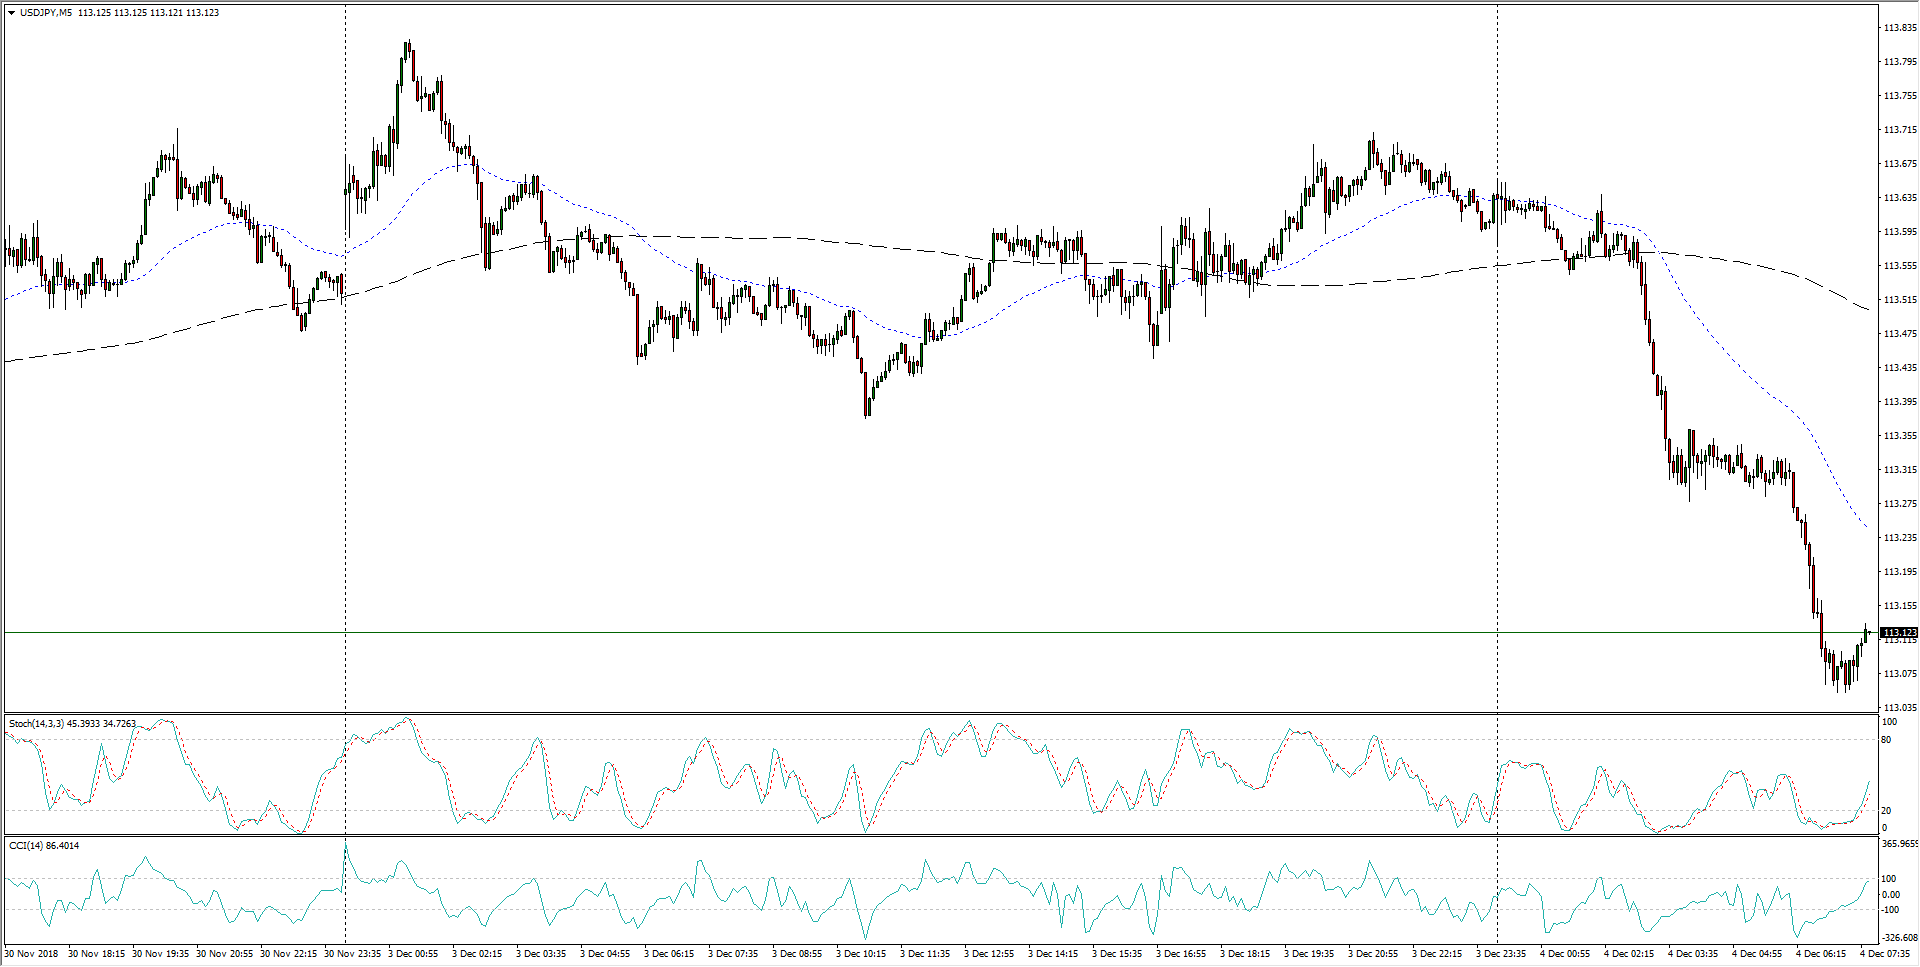
- The 113.40 region could prove to be a critical near-term level, as a retest of the area could confirm a bearish break of a rough descending triangle, and continued downside pressure remains limited with the 113.00 handle acting as firm resistance-turned-support over the past couple of weeks.
USD/JPY, 30-Minute
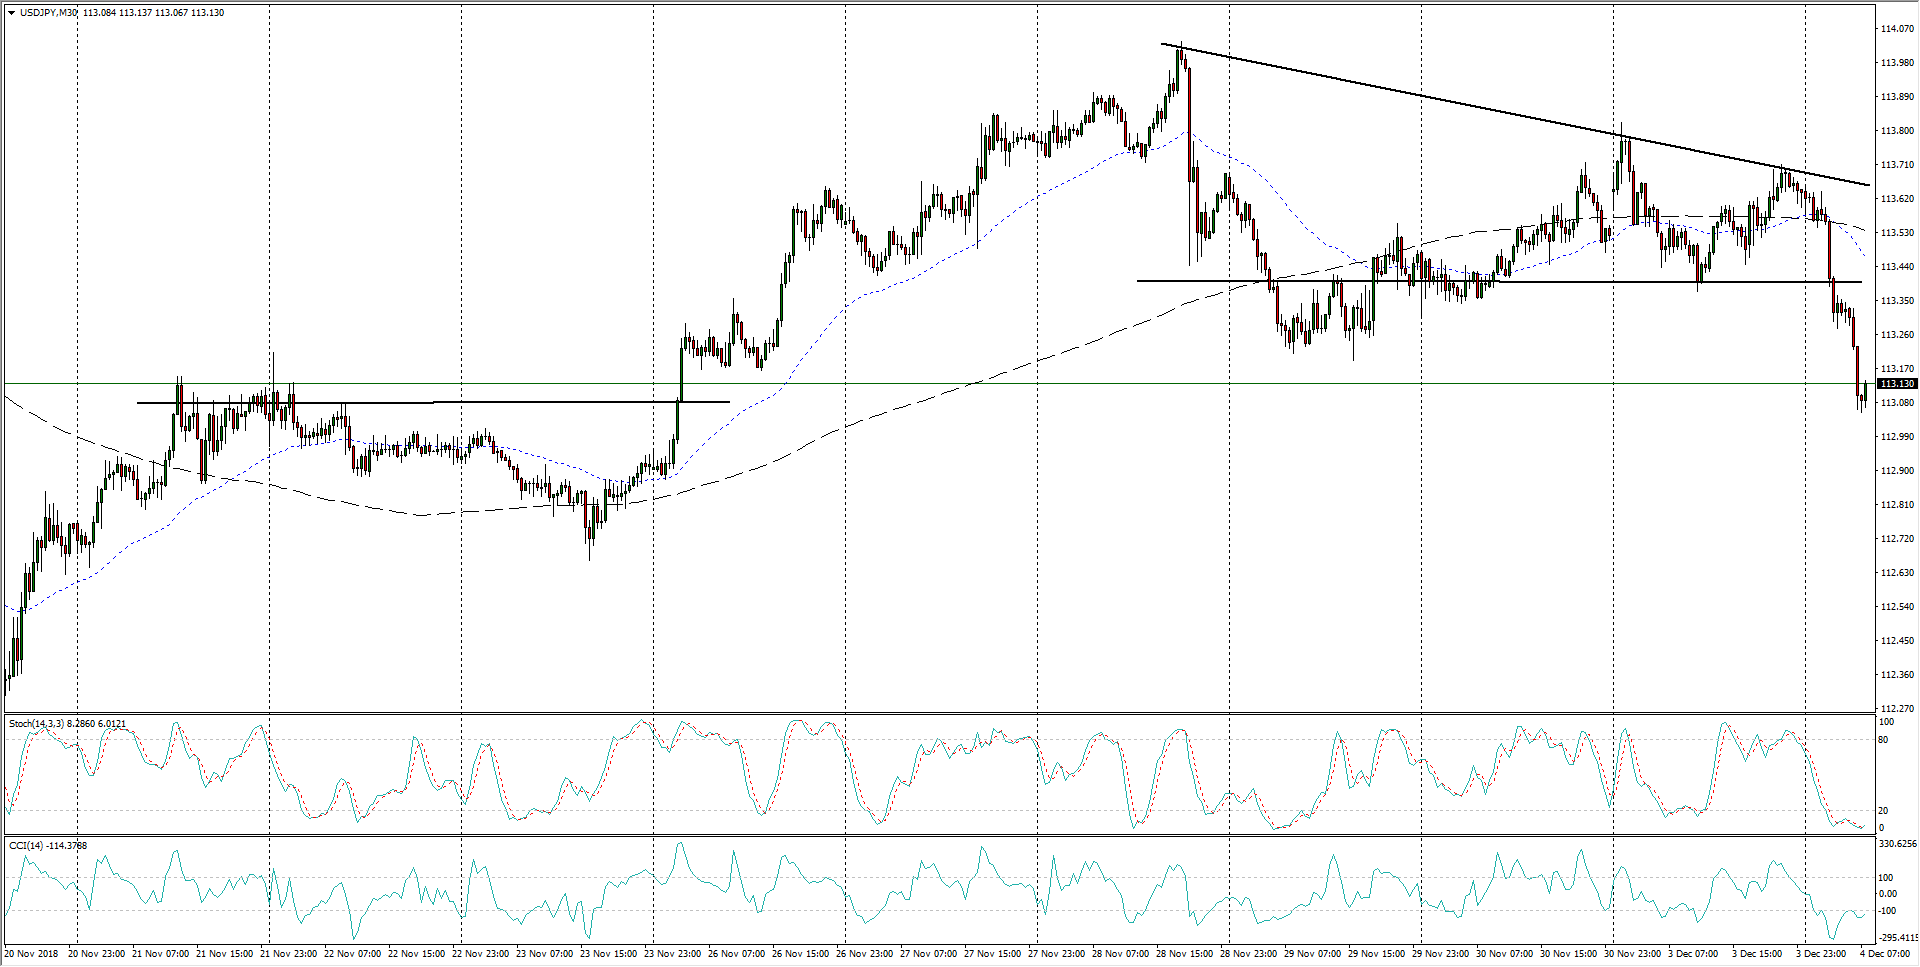
- In the medium-term, USD/JPY remains trapped within a sideways triangle, and lack of directional bias leaves the pair strung up on the 200-hour moving average, which will continue to act more like a magnet than a support-resistance level until a major trend break is made.
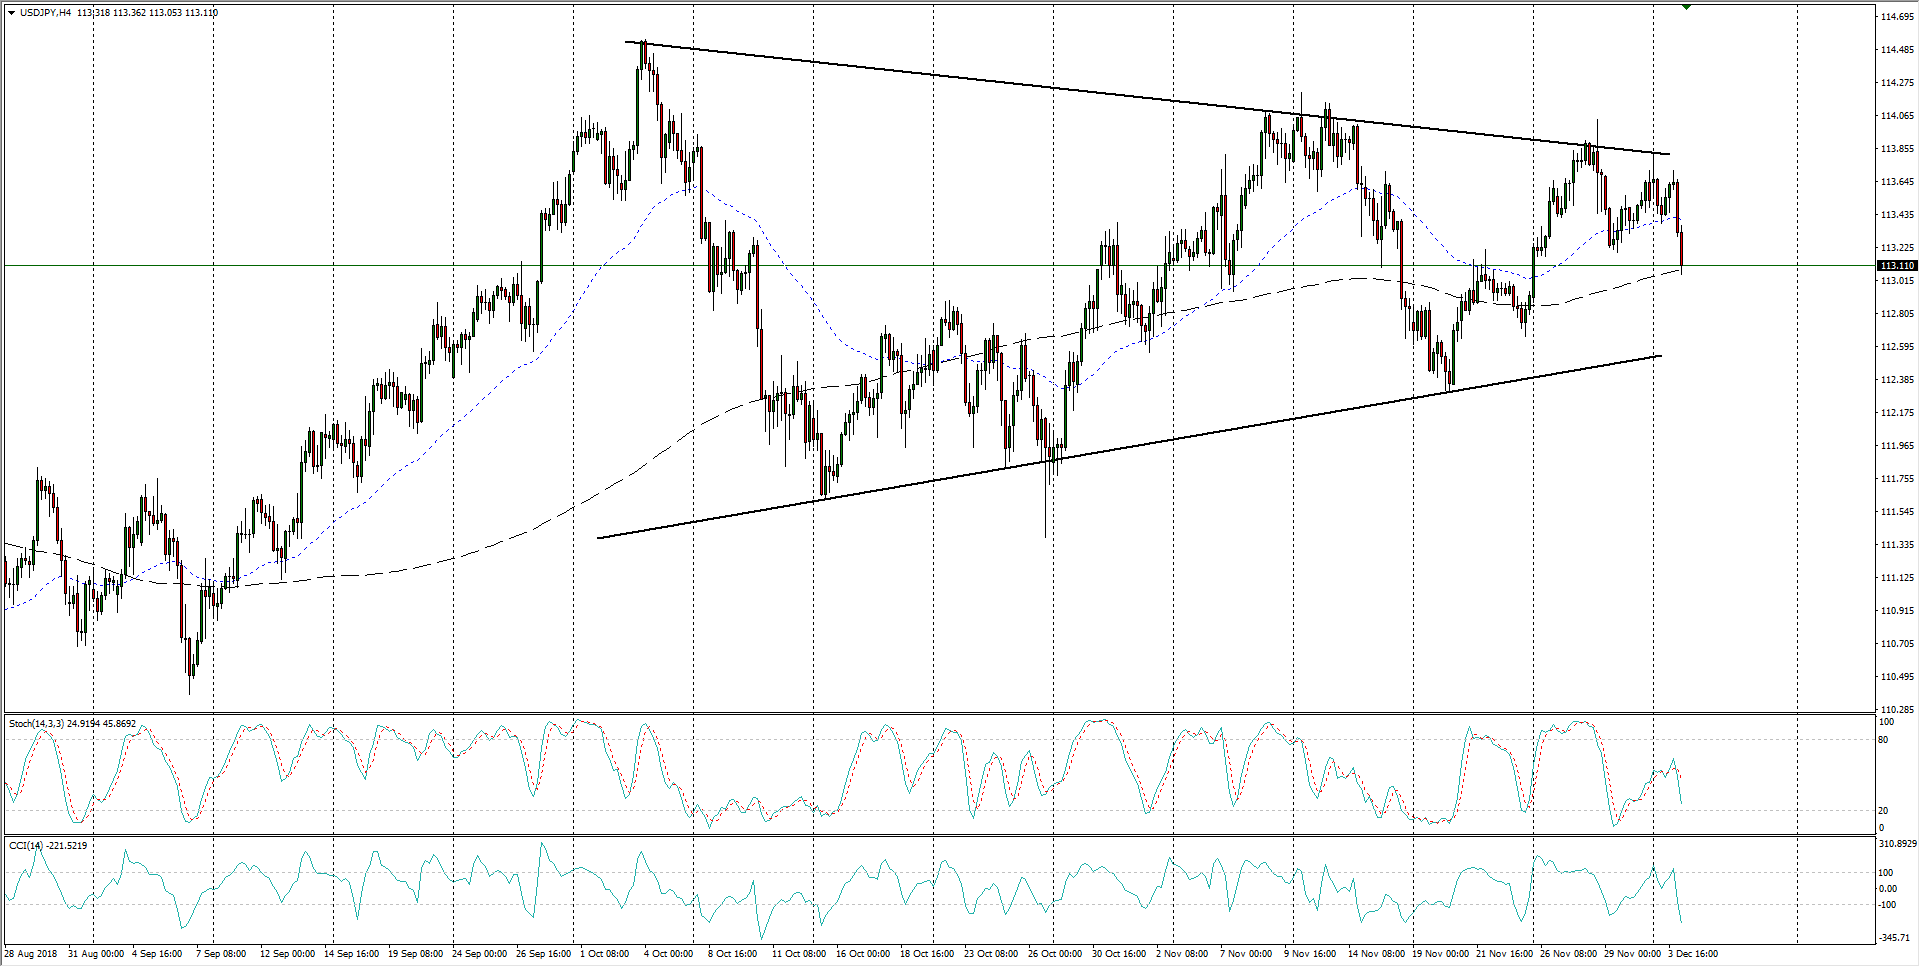
USD/JPY, 4-Hour
USD/JPY
Overview:
Today Last Price: 113.08
Today Daily change: -58 pips
Today Daily change %: -0.510%
Today Daily Open: 113.66
Trends:
Previous Daily SMA20: 113.4
Previous Daily SMA50: 113.08
Previous Daily SMA100: 112.25
Previous Daily SMA200: 110.46
Levels:
Previous Daily High: 113.83
Previous Daily Low: 113.37
Previous Weekly High: 114.04
Previous Weekly Low: 112.88
Previous Monthly High: 114.25
Previous Monthly Low: 112.3
Previous Daily Fibonacci 38.2%: 113.55
Previous Daily Fibonacci 61.8%: 113.65
Previous Daily Pivot Point S1: 113.41
Previous Daily Pivot Point S2: 113.17
Previous Daily Pivot Point S3: 112.96
Previous Daily Pivot Point R1: 113.87
Previous Daily Pivot Point R2: 114.07
Previous Daily Pivot Point R3: 114.32
Author

Joshua Gibson
FXStreet
Joshua joins the FXStreet team as an Economics and Finance double major from Vancouver Island University with twelve years' experience as an independent trader focusing on technical analysis.


