|

USD/JPY Technical Analysis: Has the Dollar topped out near 112.00 resistance against Yen ?
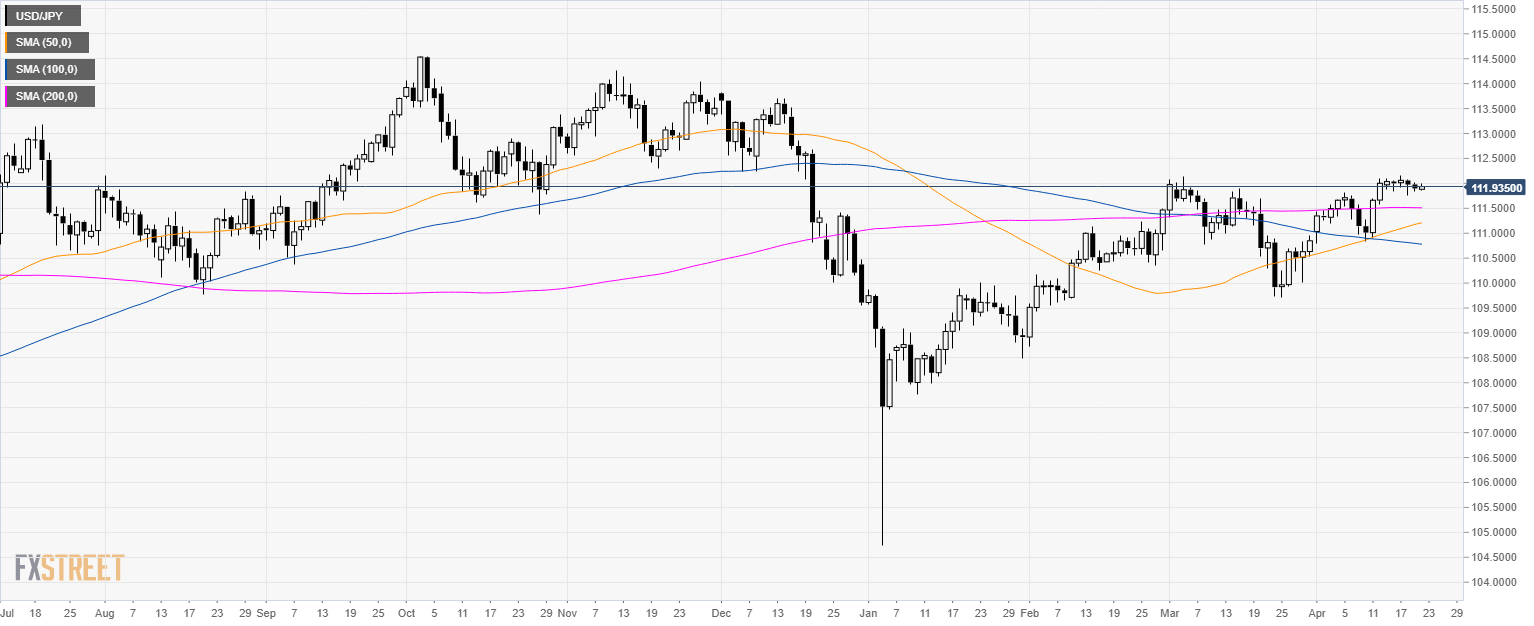
USD/JPY daily chart

  • USD/JPY is trading sideways above its 200-day simple moving average (SMA).

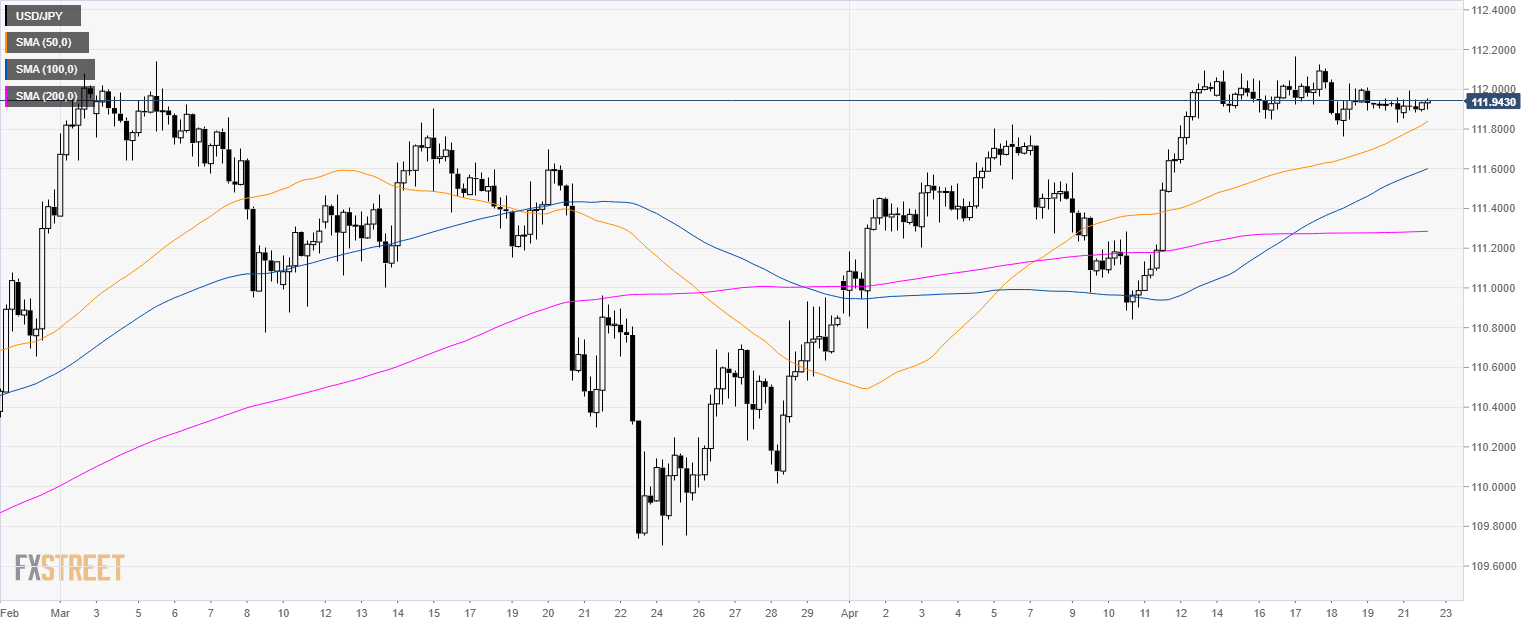
USD/JPY 4-hour chart

  • USD/JPY is stuck near the 112.00 level. 

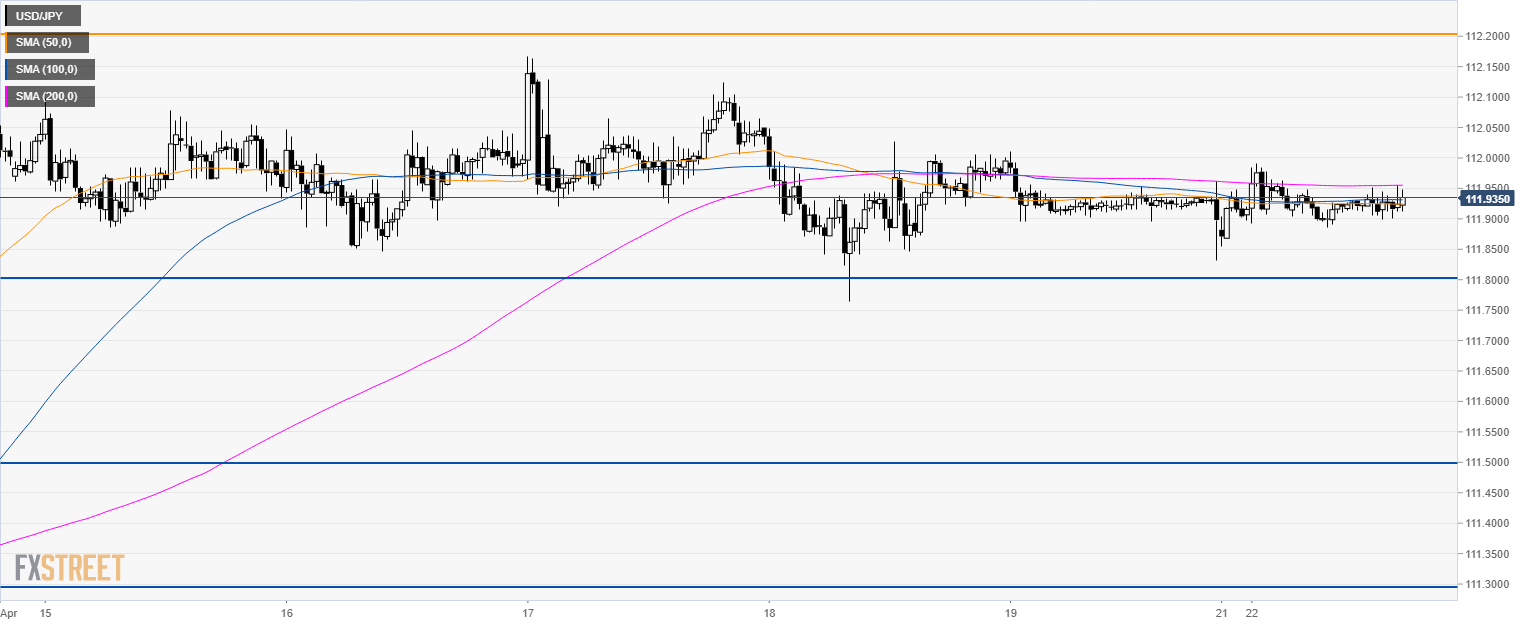
USD/JPY 30-minute chart

  • USD/JPY is drifting below its 200 SMA suggesting a bearish bias in the short-term.
  • USD/JPY bulls had their chance but the 112.00/112.20 resistances appear to be impenetrable for now.
  • The levels to downside near 111.80, 111.50 and 111.30 become exposed to bearish incursions.

Additional key levels

USD/JPY

Overview
Today last price111.94
Today Daily Change0.04
Today Daily Change %0.04
Today daily open111.9
 
Trends
Daily SMA20111.37
Daily SMA50111.18
Daily SMA100110.8
Daily SMA200111.51
Levels
Previous Daily High112.01
Previous Daily Low111.83
Previous Weekly High112.17
Previous Weekly Low111.76
Previous Monthly High112.14
Previous Monthly Low109.71
Daily Fibonacci 38.2%111.9
Daily Fibonacci 61.8%111.94
Daily Pivot Point S1111.82
Daily Pivot Point S2111.74
Daily Pivot Point S3111.64
Daily Pivot Point R1111.99
Daily Pivot Point R2112.09
Daily Pivot Point R3112.17

Author

Flavio Tosti

Flavio Tosti

Independent Analyst


More from Flavio Tosti
Share:

Editor's Picks

EUR/USD flirts with weekly lows near 1.1770

EUR/USD now comes under further selling pressure, breaking below the 1.1800 support to challenge the area of weekly throughs near 1.1770 on Thursday. The pair’s decline comes in response to marked gains in the US Dollar amid steady geopolitical tensions. Ealier in the day, the ECB’s Lagarde delivered cautious remarks, although the currency remained apathetic.

GBP/USD threatens the 200-day SMA near 1.3440

GBP/USD rapidly leaves behind Wednesday’s strong advance, coming under heavy pressure and retesting the 1.3440 zone, where the critical 200-day SMA is located. Cable’s deep pullback follows the strong gains in the Greenback, while investors continue to pencil in a potential BoE rate cut in March.

Gold trims gains, slips back to around $5,170

Gold is now facing some downside pressure, hovering around the $5,170 region on Thursday. The yellow metal surrenders part of its earlier gains on the back of the resurgence of the buying interest in the Greenback. In the meantime, geopolitical tensions in the Middle East continue to limit the downside potential for now.

Stellar: Relief bounce fades as bearish undertone persists

Stellar is trading around $0.16 at the time of writing on Thursday after rebounding more than 8% in the previous day. Derivatives data paints a negative picture as XLM’s short bets hit a monthly high while Open Interest continues to decline.

Changing the game: International implications of recent tariff developments

The Supreme Court ruling on International Emergency Economic Powers Act (IEEPA) tariffs provides limited relief for the rest of the world, with weighted average tariff rates modestly lower.

Bitcoin steadies as traders eye US–Iran talks

Bitcoin (BTC) price is stabilizing around $68,000 at the time of writing on Thursday after a 6.2% relief rally the previous day amid a broader downward trend.