|

USD/JPY technical analysis: Greenback trading at three-month highs against Yen, more upside likely

  • USD/JPY is clinging to multi-month highs near the 109.00 handle
  • The level to beat for bulls is the 109.15 resistance.
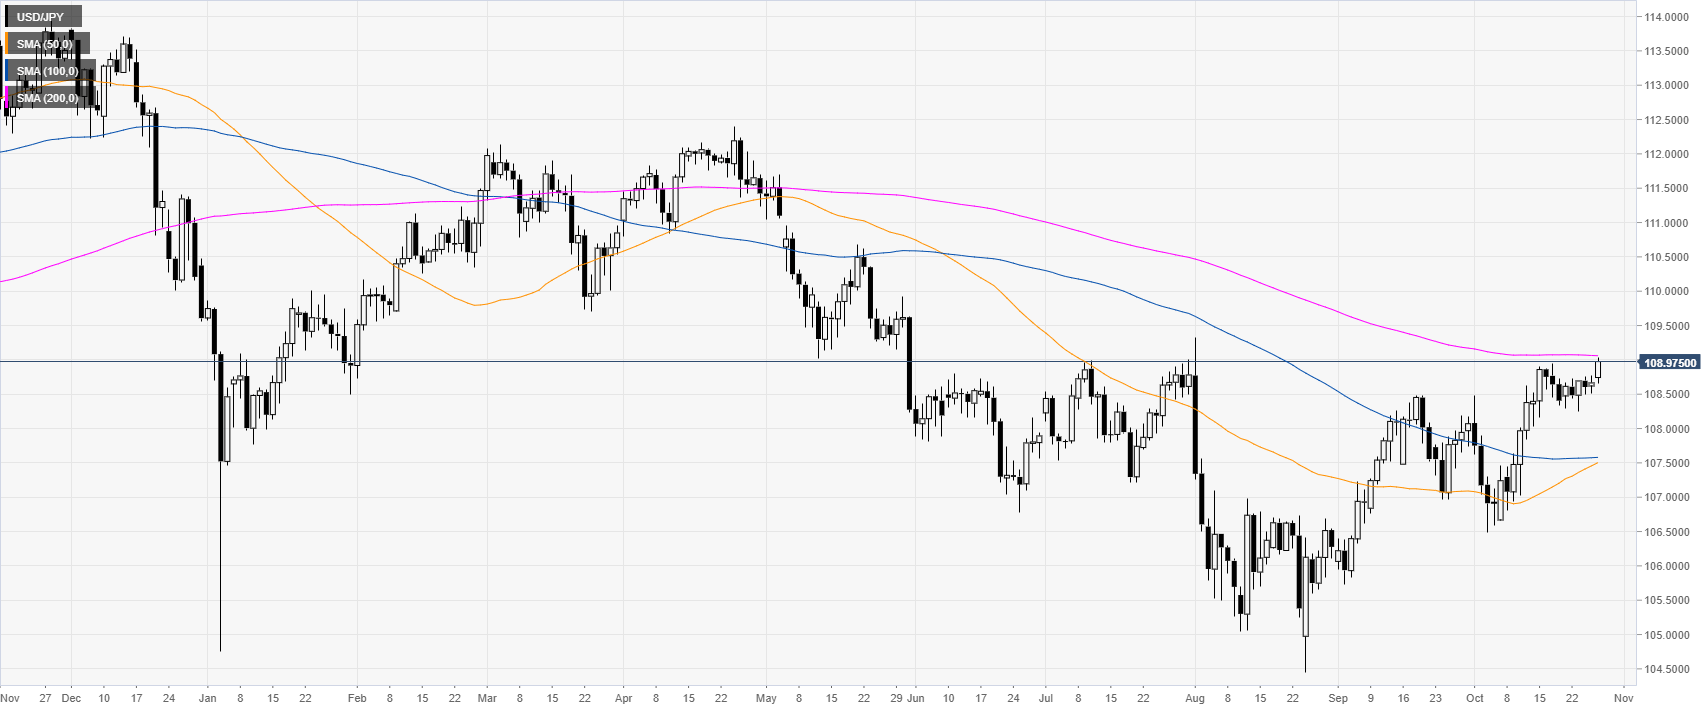


USD/JPY daily chart


USD/JPY is challenging the 200-day simple moving average (DMA) at the 109.06 level. Since August, the market has been rebounding sharply. As discussed last Friday, USD/JPY is gaining further steam this week. 


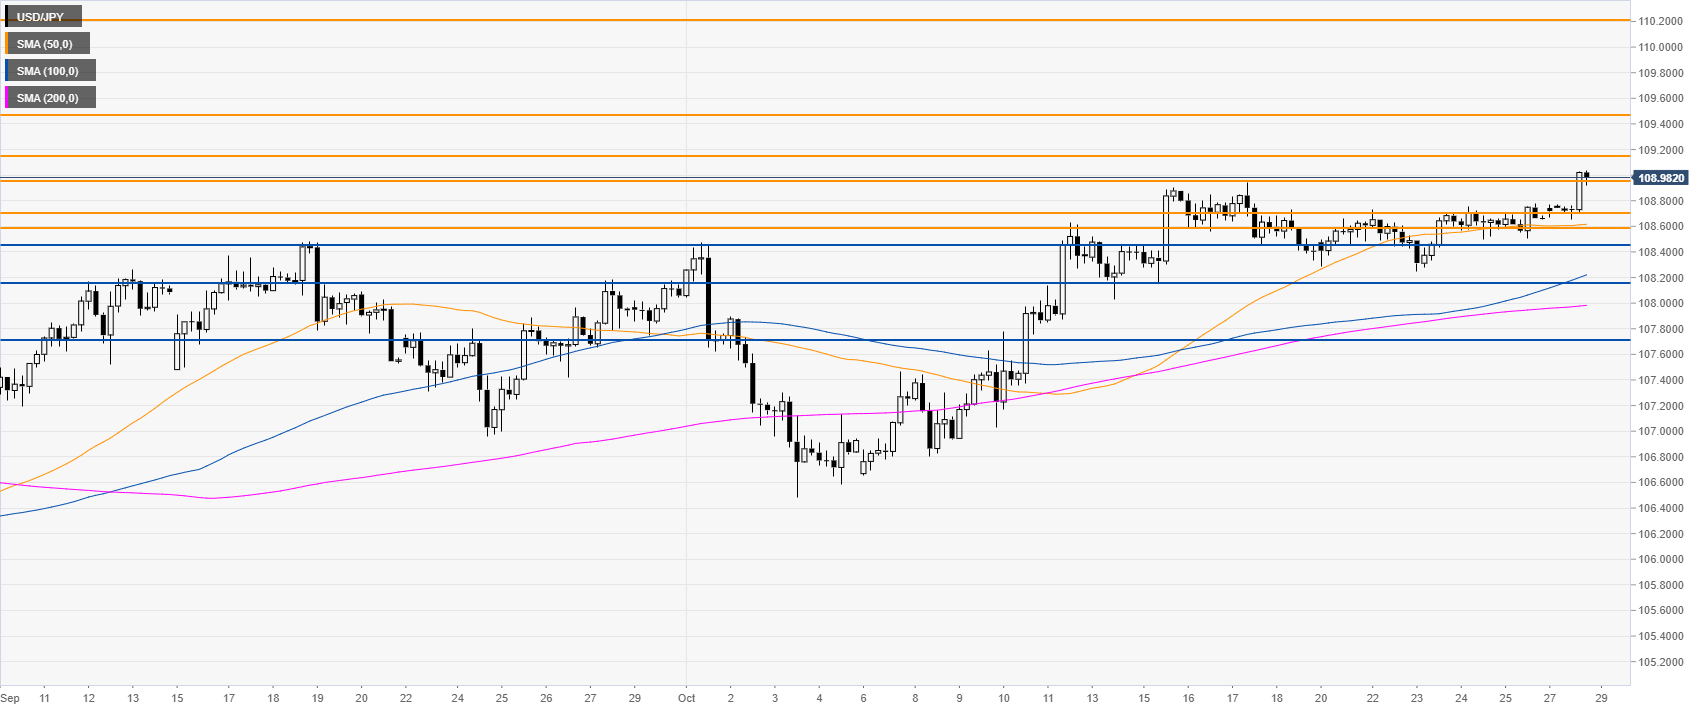
USD/JPY four-hour chart


USD/JPY is trading above its main SMAs on the four-hour chart, suggesting a bullish bias in the medium term. Bulls need to overcome the 109.15 resistance to continue the bull leg towards the 109.45 and 110.17 price levels, according to the Technical Confluences Indicator
 

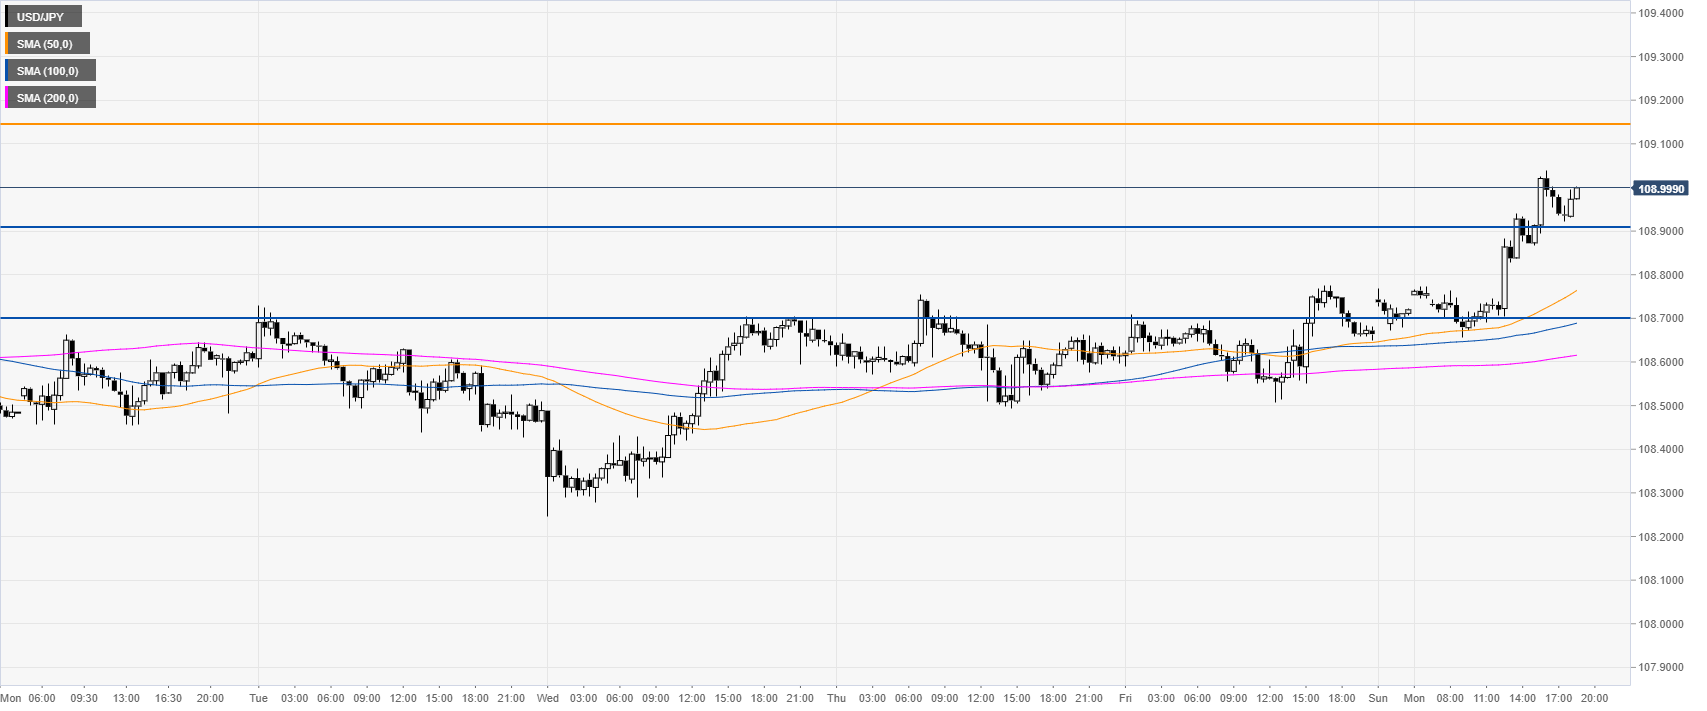
USD/JPY 30-minute chart

 
USD/JPY is trading above its main SMAs, suggesting a bullish bias in the near term. Support is seen at the 108.92 and 108.70 levels, according to the Technical Confluences Indicator. 


Additional key levels

USD/JPY

Overview
Today last price108.97
Today Daily Change0.31
Today Daily Change %0.29
Today daily open108.66
 
Trends
Daily SMA20108.05
Daily SMA50107.46
Daily SMA100107.58
Daily SMA200109.06
 
Levels
Previous Daily High108.78
Previous Daily Low108.51
Previous Weekly High108.78
Previous Weekly Low108.25
Previous Monthly High108.48
Previous Monthly Low105.74
Daily Fibonacci 38.2%108.67
Daily Fibonacci 61.8%108.61
Daily Pivot Point S1108.52
Daily Pivot Point S2108.38
Daily Pivot Point S3108.25
Daily Pivot Point R1108.79
Daily Pivot Point R2108.92
Daily Pivot Point R3109.06

Author

Flavio Tosti

Flavio Tosti

Independent Analyst


More from Flavio Tosti
Share:

Editor's Picks

EUR/USD accelerates losses, focus is on 1.1800

EUR/USD’s selling pressure is gathering pace now, opening the door to a potential test of the key 1.1800 region sooner rather than later. The pair’s pullback comes on the back of marked gains in the US Dollar following US data releases and the publication of the FOMC Minutes later in the day.

GBP/USD turns negative near 1.3540

GBP/USD reverses its initial upside momentum and is now adding to previous declines, revisiting at the same time the 1.3540 region on Wednesday. Cable’s downtick comes on the back of decent gains in the Greenback and easing UK inflation figures, which seem to have reinforced the case for a BoE rate cut in March.

Gold picks pace, flirts with $5,000

Gold is back on the front foot on Wednesday, shaking off part of the early week softness and pushing higher towards the key $5,000 mark per troy ounce. The move comes ahead of the FOMC Minutes and is unfolding despite an intense rebound in the US Dollar.

Fed Minutes to shed light on January hold decision amid hawkish rate outlook

The Minutes of the Fed’s January 27-28 monetary policy meeting will be published today. Details of discussions on the decision to leave the policy rate unchanged will be scrutinized by investors.

Mixed UK inflation data no gamechanger for the Bank of England

Food inflation plunged in January, but service sector price pressure is proving stickier. We continue to expect Bank of England rate cuts in March and June. The latest UK inflation read is a mixed bag for the Bank of England, but we doubt it drastically changes the odds of a March rate cut.

Sui extends sideways action ahead of Grayscale’s GSUI ETF launch

Sui is extending its downtrend for the second consecutive day, trading at 0.95 at the time of writing on Wednesday. The Layer-1 token is down over 16% in February and approximately 34% from the start of the year, aligning with the overall bearish sentiment across the crypto market.