|

USD/JPY technical analysis: Greenback sidelined near 108.60 ahead of the FOMC

  • USD/JPY is hovering below the monthly high below the 108.50 resistance.
  • The market is awaiting the FOMC scheduled at 18:00 GMT.
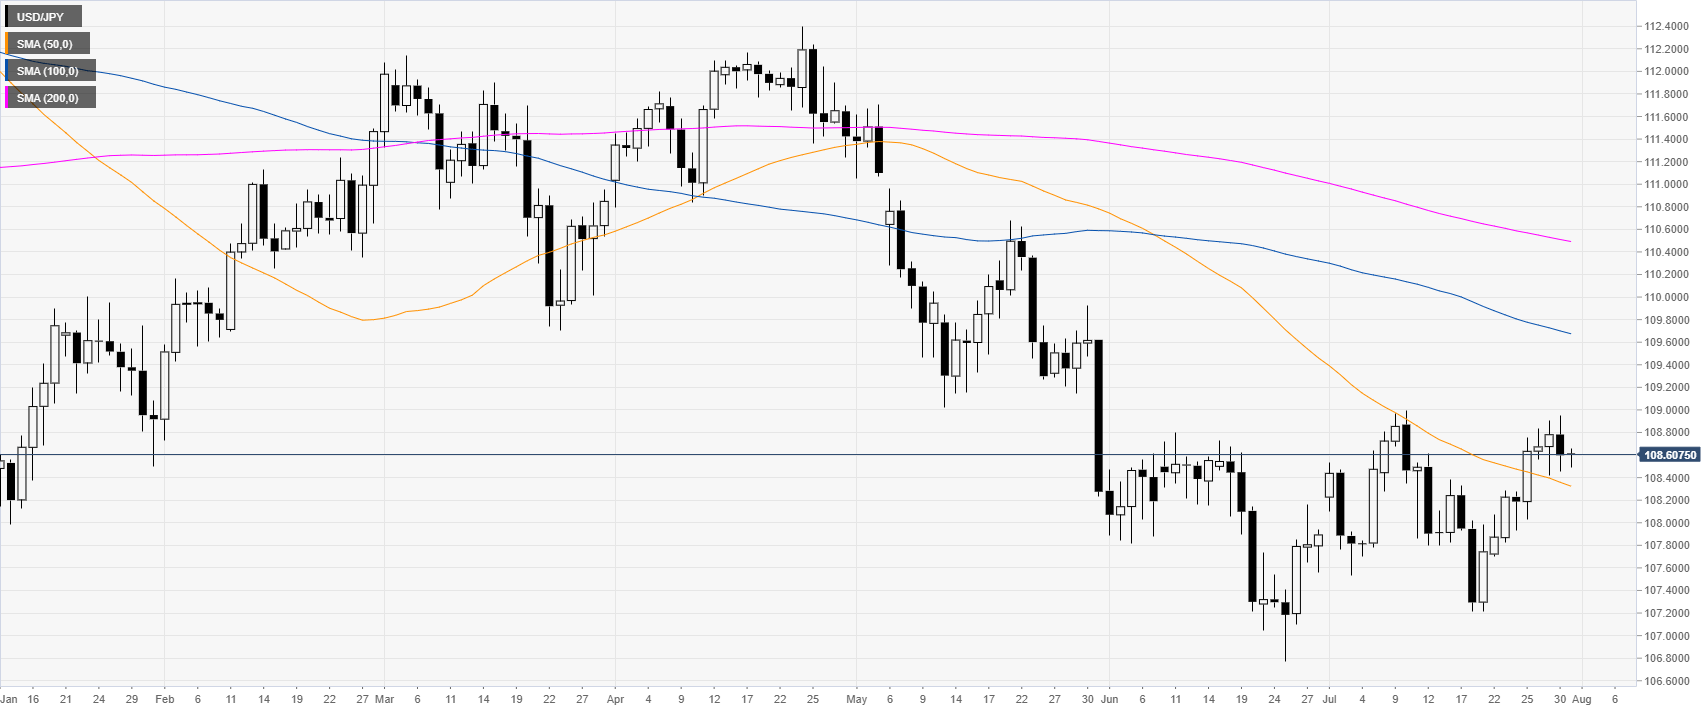
 

USD/JPY daily chart


USD/JPY is off the monthly highs as the market is trading above the 50-day simple moving average (DSMA). The market is expeceting the Federal Reserve to cut 25bps this Wednesday. However market participants are going to pay close attention to any comments from Fed’s Chairman Powell.
 

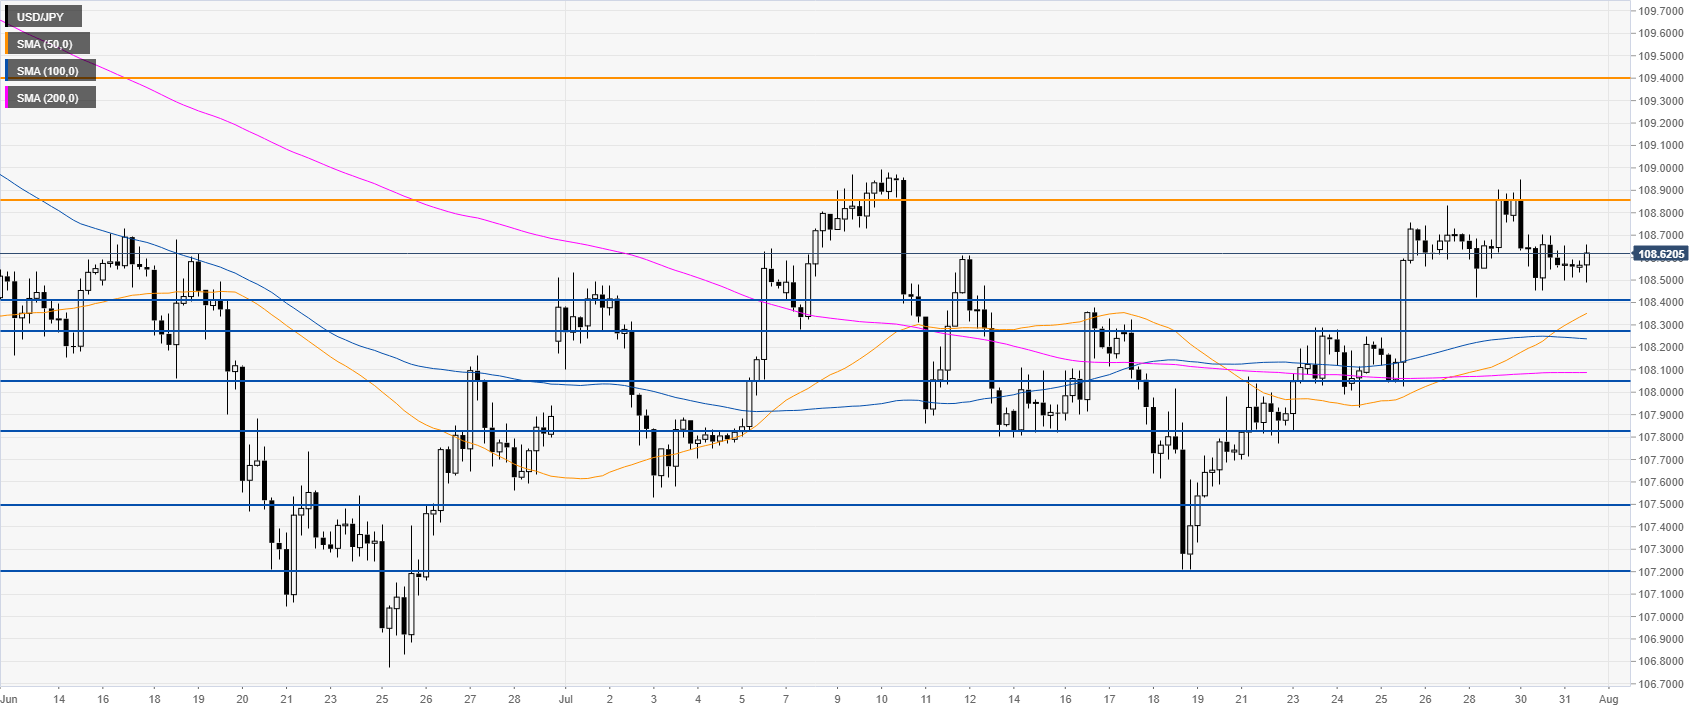
USD/JPY 4-hour chart


USD/JPY is above its main SMAs, suggesting a bullish bias in the medium term. Bulls need a breakout above 108.50 to get to 109.40 resistance on the way up, according to the Technical Confluences Indicator.


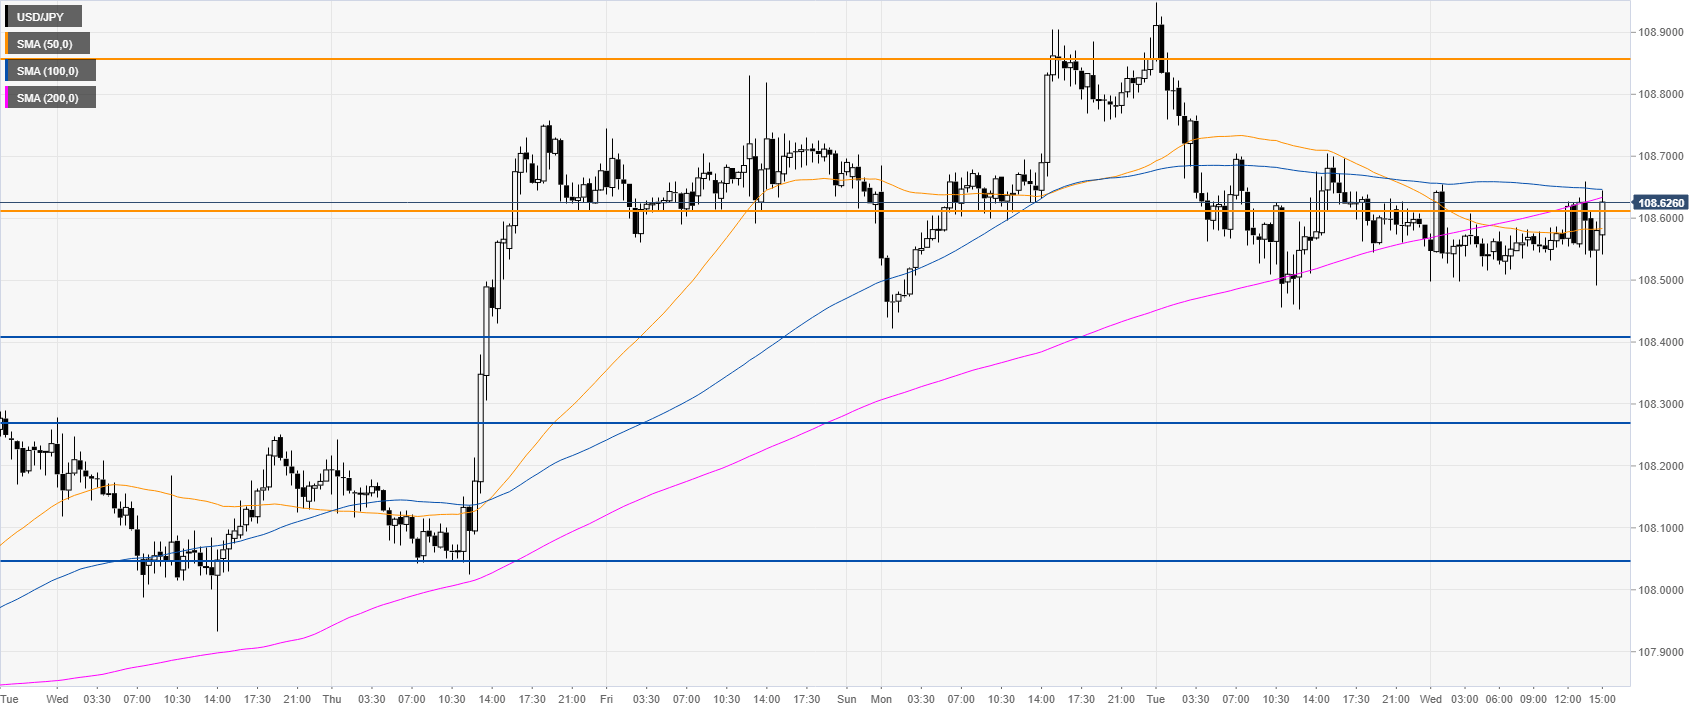
USD/JPY 30-minute chart

 
USD/JPY is trading below the 100 and 200 SMAs, suggesting a potential pullback down in the near term. The market might declines towards the 108.41 and 108.03 support levels, according to the Technical Confluences Indicator. 
 

Additional key levels

USD/JPY

Overview
Today last price108.61
Today Daily Change0.01
Today Daily Change %0.01
Today daily open108.6
 
Trends
Daily SMA20108.23
Daily SMA50108.36
Daily SMA100109.7
Daily SMA200110.51
Levels
Previous Daily High108.95
Previous Daily Low108.45
Previous Weekly High108.83
Previous Weekly Low107.7
Previous Monthly High108.8
Previous Monthly Low106.78
Daily Fibonacci 38.2%108.64
Daily Fibonacci 61.8%108.76
Daily Pivot Point S1108.38
Daily Pivot Point S2108.17
Daily Pivot Point S3107.89
Daily Pivot Point R1108.88
Daily Pivot Point R2109.16
Daily Pivot Point R3109.38

Author

Flavio Tosti

Flavio Tosti

Independent Analyst


More from Flavio Tosti
Share:

Editor's Picks

EUR/USD flirts with three-day lows near 1.1570

EUR/USD resumes its march south on Thursday, revisting the 1.1570 region, or three-day lows, ahead of the opening bell in Asia. The intense sell-off in the pair comes in response to the solid performance of the US Dollar amid the still unresolved crisis in the Middle East. Moving forward, investors are expected to shift their focus to the release of the US NFP on Friday.
 

GBP/USD stays offered near 1.3340

GBP/USD fades Wednesday’s uptick and trades with decent losses in the 1.3340 zone in the latter part of Thursday’s session. Cable’s weakness, alongside the rest of the risk complex, follows the strong performance of the Greenback amid intense geopolitical jitters.

Gold: further weakness could challenge $5,000

Gold comes under fresh selling pressure on Thursday, slipping back below the $5,100 mark per troy ounce. Persistent strength in the US Dollar (USD) is preventing the yellow metal from building a meaningful recovery, even as markets remain risk-averse amid the deepening conflict in the Middle East.

XRP rises as crypto market steadies despite Middle East war

Ripple (XRP) continues to demonstrate notable resilience as the cryptocurrency market navigates the persistent war in the Middle East after the United States (US) and Israel attacked Iran on Saturday.

Two PMIs, two Chinas

China’s economic data are often treated with a degree of caution by global investors. The challenge is not necessarily that the numbers are incorrect, but that they can describe very different parts of a vast and complex economy. Nowhere is that more evident than in China’s PMIs.

Ripple tests recovery strength amid steady ETF inflows, growing retail interest

Ripple (XRP) continues to demonstrate notable resilience as the cryptocurrency market navigates the persistent war in the Middle East after the United States (US) and Israel attacked Iran on Saturday.