USD/JPY technical analysis: Greenback sidelined ahead of the FOMC


  • USD/JPY is trading in a 20-pip range ahead of the FOMC at 18:00 GMT.
  • The market is directionless ahead of the event, which should unlock the situation. 
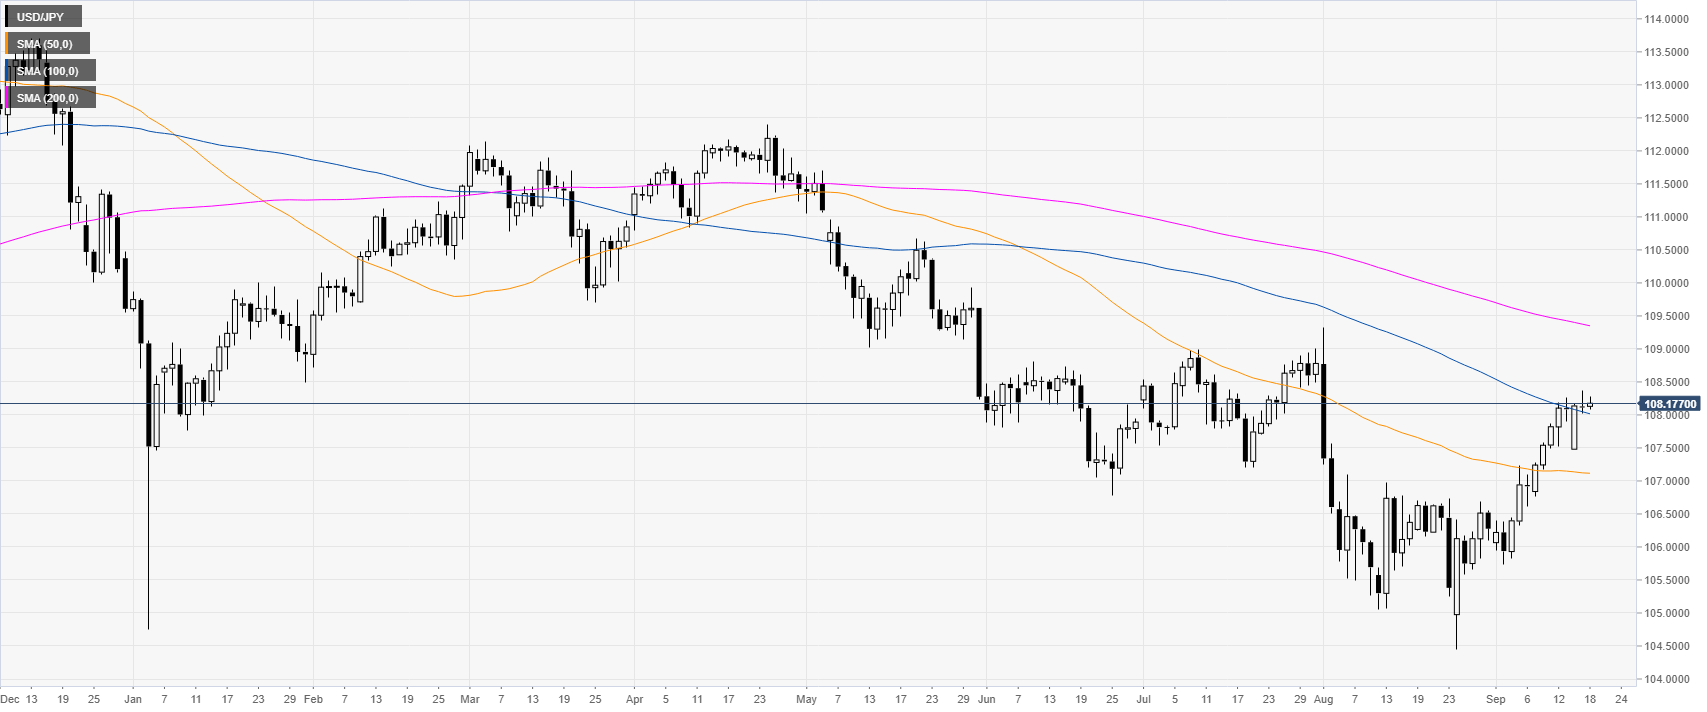
 

USD/JPY daily chart


USD/JPY is trading in a bear trend below the 200-day simple moving averages (SMA). However, in the last two months, USD/JPY had a substantial advance which is now challenging the 100 SMA and the 108.00 handle. 


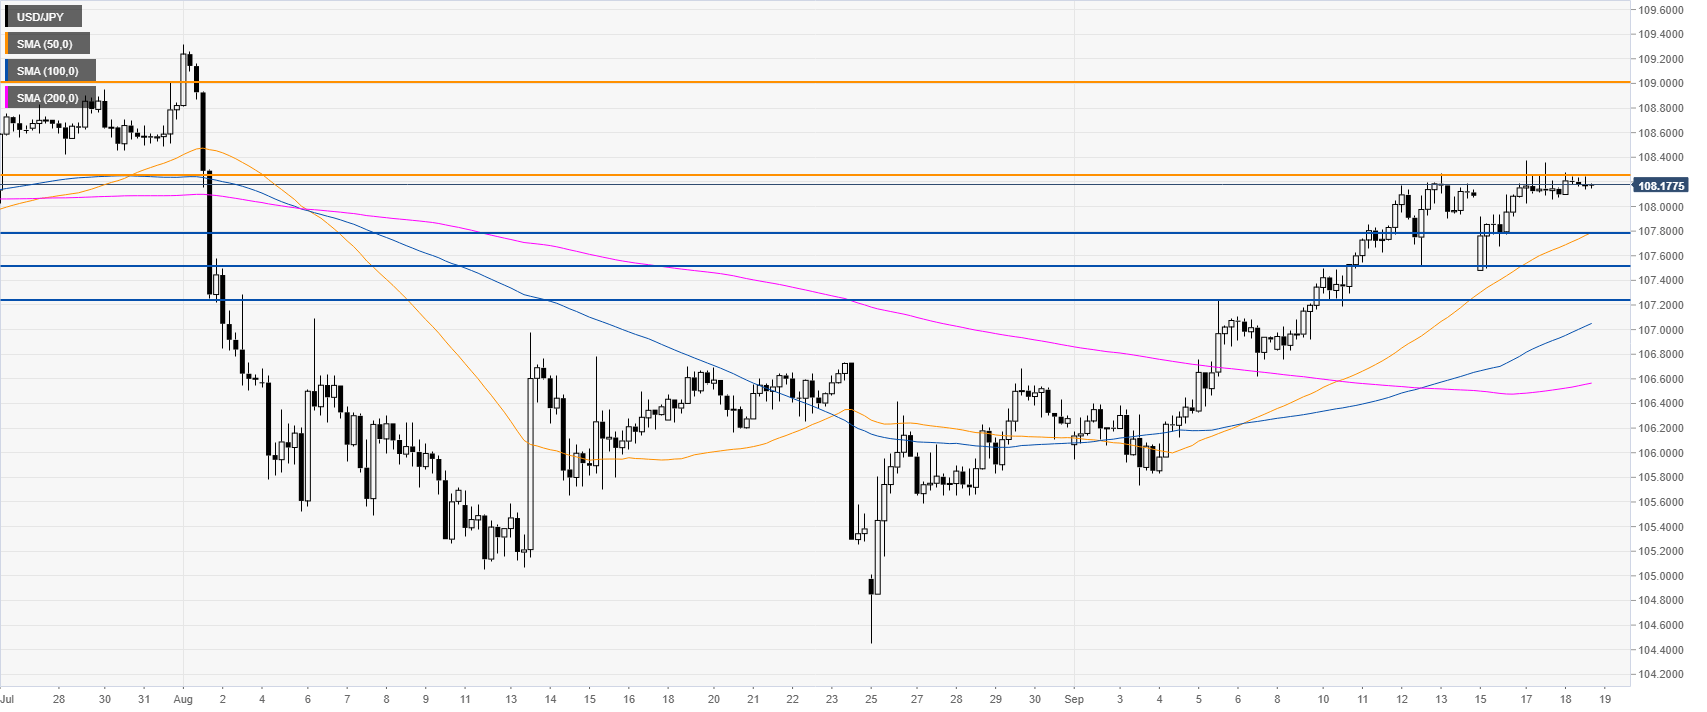
USD/JPY 4-hour chart


USD/JPY is trading above the main SMAs, suggesting a bullish bias in the medium term. The bull trend remains intact as bulls will try to push the spot beyond the 108.24 resistance level in order to potentially target the 109.00 resistance level, according to the Technical Confluences Indicator. However, the market is relatively balanced and the FOMC at 18:00 GMT will likely unlock the status quo.


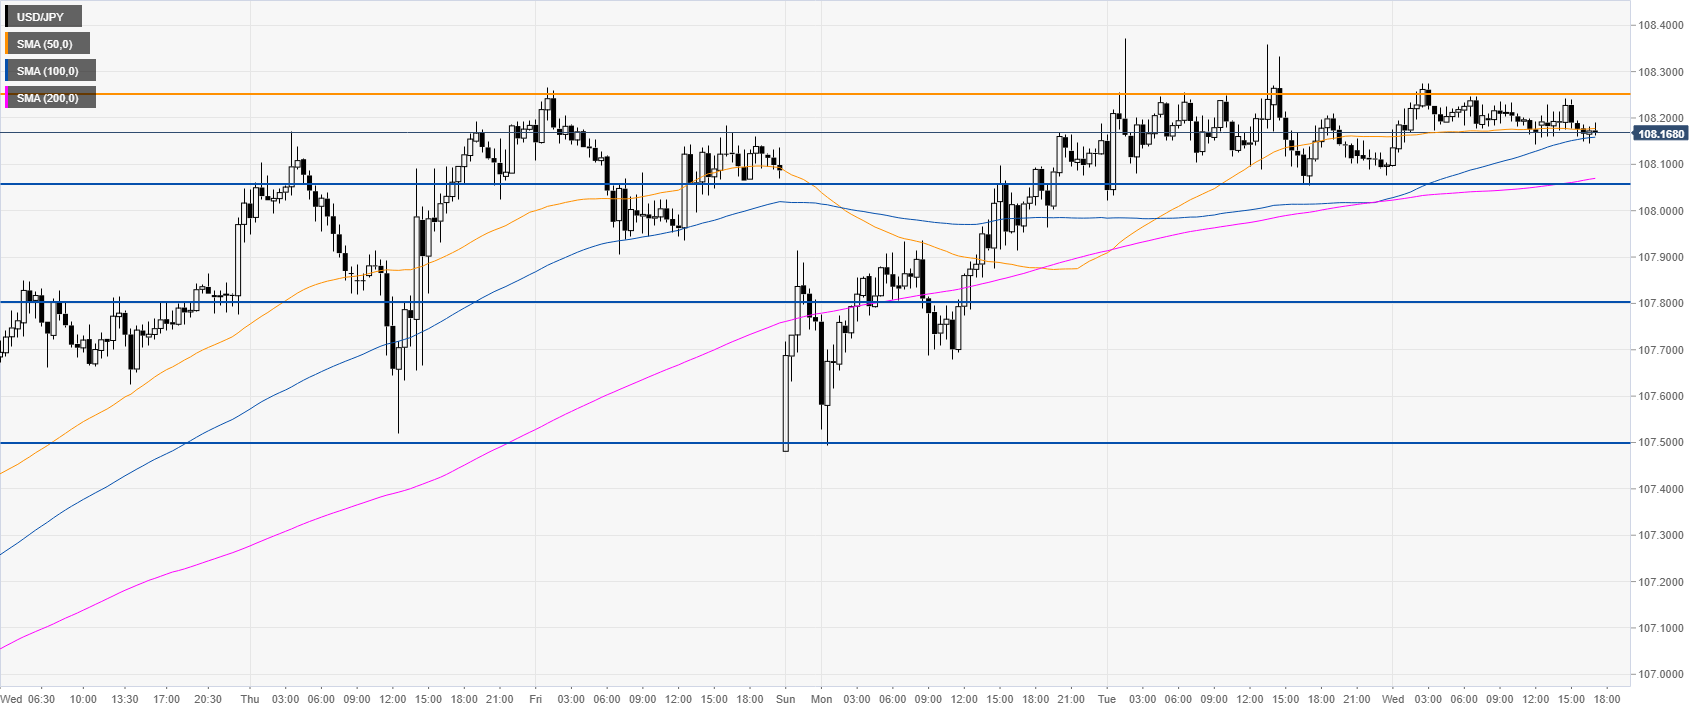
USD/JPY 30-minute chart


Dollar/Yen is trading above the main SMAs, suggesting bullish momentum in the near term. If the FOMC is perceived as dovish, USD/JPY will likely trade south towards 108.05, 107.80 and 107.50 price levels, according to the Technical Confluences Indicator. 
 

Additional key levels

USD/JPY

Overview
Today last price 108.17
Today Daily Change 0.06
Today Daily Change % 0.06
Today daily open 108.11
 
Trends
Daily SMA20 106.83
Daily SMA50 107.12
Daily SMA100 108.05
Daily SMA200 109.38
 
Levels
Previous Daily High 108.37
Previous Daily Low 108.02
Previous Weekly High 108.26
Previous Weekly Low 106.76
Previous Monthly High 109.32
Previous Monthly Low 104.45
Daily Fibonacci 38.2% 108.16
Daily Fibonacci 61.8% 108.24
Daily Pivot Point S1 107.97
Daily Pivot Point S2 107.82
Daily Pivot Point S3 107.62
Daily Pivot Point R1 108.32
Daily Pivot Point R2 108.52
Daily Pivot Point R3 108.67


Share: Feed news

Note: All information on this page is subject to change. The use of this website constitutes acceptance of our user agreement. Please read our privacy policy and legal disclaimer. Opinions expressed at FXstreet.com are those of the individual authors and do not necessarily represent the opinion of FXstreet.com or its management. Risk Disclosure: Trading foreign exchange on margin carries a high level of risk, and may not be suitable for all investors. The high degree of leverage can work against you as well as for you. Before deciding to invest in foreign exchange you should carefully consider your investment objectives, level of experience, and risk appetite. The possibility exists that you could sustain a loss of some or all of your initial investment and therefore you should not invest money that you cannot afford to lose. You should be aware of all the risks associated with foreign exchange trading, and seek advice from an independent financial advisor if you have any doubts.

Recommended content


Recommended content

Editors’ Picks

AUD/USD: Uptrend remains capped by 0.6650

AUD/USD: Uptrend remains capped by 0.6650

AUD/USD could not sustain the multi-session march north and faltered once again ahead of the 0.6650 region on the back of the strong rebound in the Greenback and the prevailing risk-off mood.

AUD/USD News

EUR/USD meets a tough barrier around 1.0800

EUR/USD meets a tough barrier around 1.0800

The resurgence of the bid bias in the Greenback weighed on the risk-linked assets and motivated EUR/USD to retreat to the 1.0750 region after another failed attempt to retest the 1.0800 zone.

EUR/USD News

Gold eases toward $2,310 amid a better market mood

Gold eases toward $2,310 amid a better market mood

After falling to $2,310 in the early European session, Gold recovered to the $2,310 area in the second half of the day. The benchmark 10-year US Treasury bond yield stays in negative territory below 4.5% and helps XAU/USD find support.

Gold News

Bitcoin price coils up for 20% climb, Standard Chartered forecasts more gains for BTC

Bitcoin price coils up for 20% climb, Standard Chartered forecasts more gains for BTC

Bitcoin (BTC) price remains devoid of directional bias, trading sideways as part of a horizontal chop. However, this may be short-lived as BTC price action consolidates in a bullish reversal pattern on the one-day time frame.

Read more

What does stagflation mean for commodity prices?

What does stagflation mean for commodity prices?

What a difference a quarter makes. The Federal Reserve rang in 2024 with a bout of optimism that inflation was coming down to their 2% target. But that optimism has now evaporated as the reality of stickier-than-expected inflation becomes more evident. 

Read more

Forex MAJORS

Cryptocurrencies

Signatures