|

USD/JPY Technical Analysis: Greenback reverses weekly gains as Fed leaves the target for fed funds rate unchanged
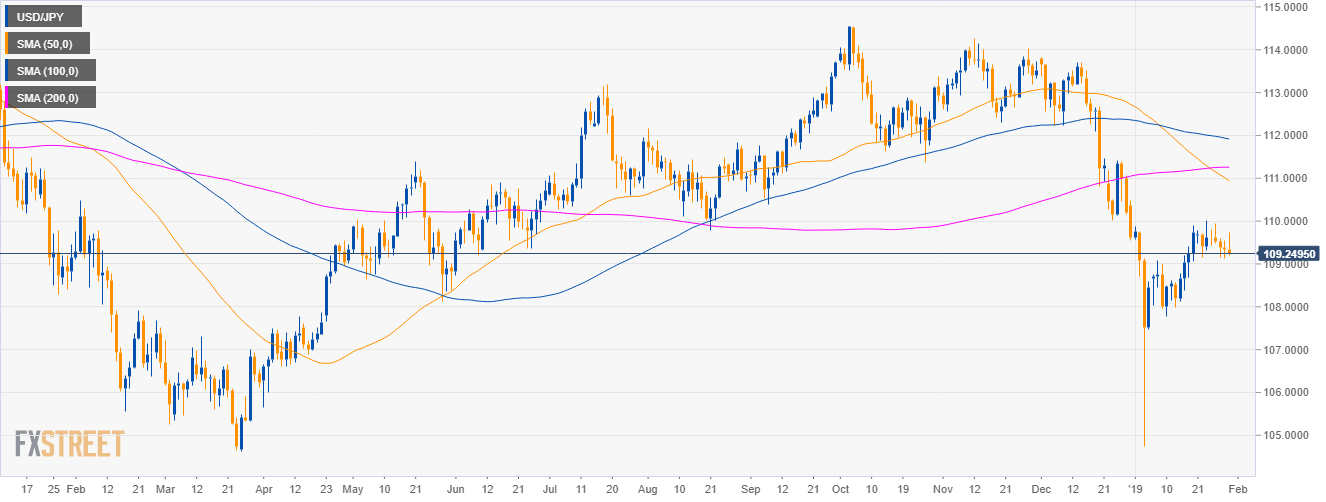
USD/JPY daily chart

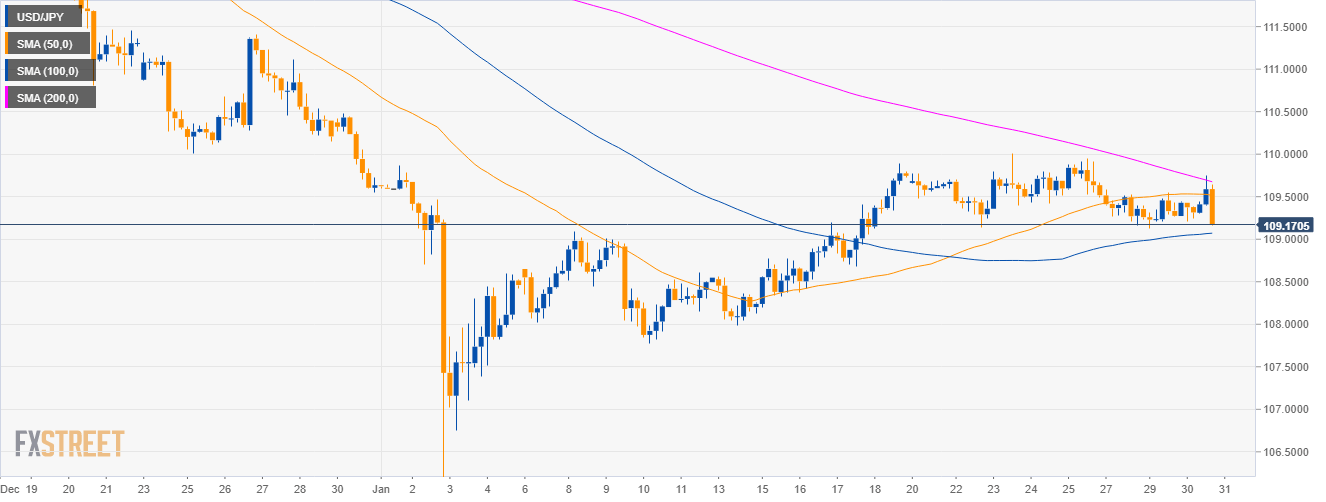
USD/JPY 4-hour chart

  • USD/JPY is trading below the 50 and 200 SMA suggesting bearish momentum in the medium-term. 

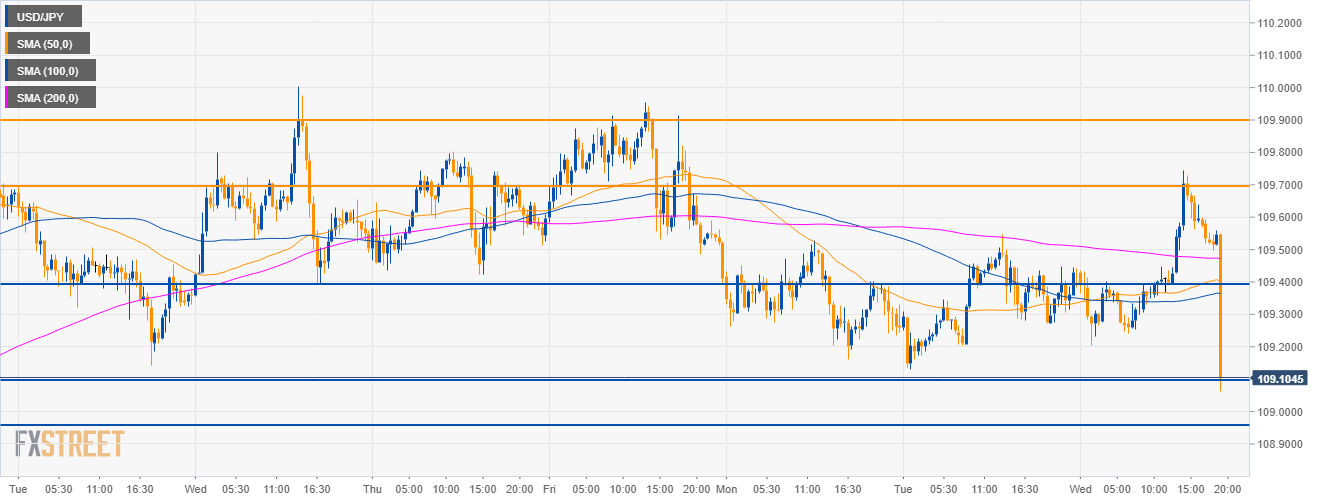
USD/JPY 30-minute chart

  • USD/JPY bears are reversing the weekly gains and en route towards the 109.00 figure. 
  • USD/JPY needs to break 109.10 support to extend losses towards 108.70 level.

Additional key levels

USD/JPY

Overview:
    Today Last Price: 109.26
    Today Daily change: -18 pips
    Today Daily change %: -0.08%
    Today Daily Open: 109.35
Trends:
    Daily SMA20: 108.95
    Daily SMA50: 111.01
    Daily SMA100: 111.94
    Daily SMA200: 111.26
Levels:
    Previous Daily High: 109.55
    Previous Daily Low: 109.13
    Previous Weekly High: 110
    Previous Weekly Low: 109.14
    Previous Monthly High: 113.83
    Previous Monthly Low: 109.55
    Daily Fibonacci 38.2%: 109.29
    Daily Fibonacci 61.8%: 109.39
    Daily Pivot Point S1: 109.14
    Daily Pivot Point S2: 108.92
    Daily Pivot Point S3: 108.72
    Daily Pivot Point R1: 109.55
    Daily Pivot Point R2: 109.76
    Daily Pivot Point R3: 109.97

Author

Flavio Tosti

Flavio Tosti

Independent Analyst


More from Flavio Tosti
Share:

Editor's Picks

EUR/USD slumps below 1.1800 on hawkish Fed Minutes, eyes on ECB succession

The EUR/USD pair tumbles to a near two-week low around 1.1785 during the early Asian session on Thursday. The US Dollar strengthens against the Euro on hawkish FOMC minutes that revived speculation about potential interest rate hikes if inflation remains elevated. 

GBP/USD extends decline as weak jobs data bolsters BoE rate cut bets

The Pound Sterling continued to backslide under sustained pressure on Wednesday, following through after the UK employment report on Tuesday showed a labour market deteriorating faster than expected. 

Gold consolidates the rebound below $5,000, US data eyed

Gold price consolidates the previous rebound below $5,000 in the Asian session on Thursday. The precious metal recovered on Wednesday amid shifts in geopolitical sentiment, boosting safe-haven demand. Traders will keep an eye on the release of US Initial Jobless Claims,  Pending Home Sales data, and the Fedspeak later on Thursday. 

Bitcoin approaches a critical zone: Bear pennant projects $56,000

Based on the most recent analyses from February 2026, the short answer is that it is highly unlikely that Bitcoin will reach $100,000 this month.

Mixed UK inflation data no gamechanger for the Bank of England

Food inflation plunged in January, but service sector price pressure is proving stickier. We continue to expect Bank of England rate cuts in March and June. The latest UK inflation read is a mixed bag for the Bank of England, but we doubt it drastically changes the odds of a March rate cut.

Sui extends sideways action ahead of Grayscale’s GSUI ETF launch

Sui is extending its downtrend for the second consecutive day, trading at 0.95 at the time of writing on Wednesday. The Layer-1 token is down over 16% in February and approximately 34% from the start of the year, aligning with the overall bearish sentiment across the crypto market.