|

USD/JPY technical analysis: Greenback is under pressure below the 107.00 handle

  • The ISM Non-Manufacturing PMI in September disappointed the market dropping to 52.6 in vs. 55 forecast.
  • The level to beat for bears is the 106.50 support level.
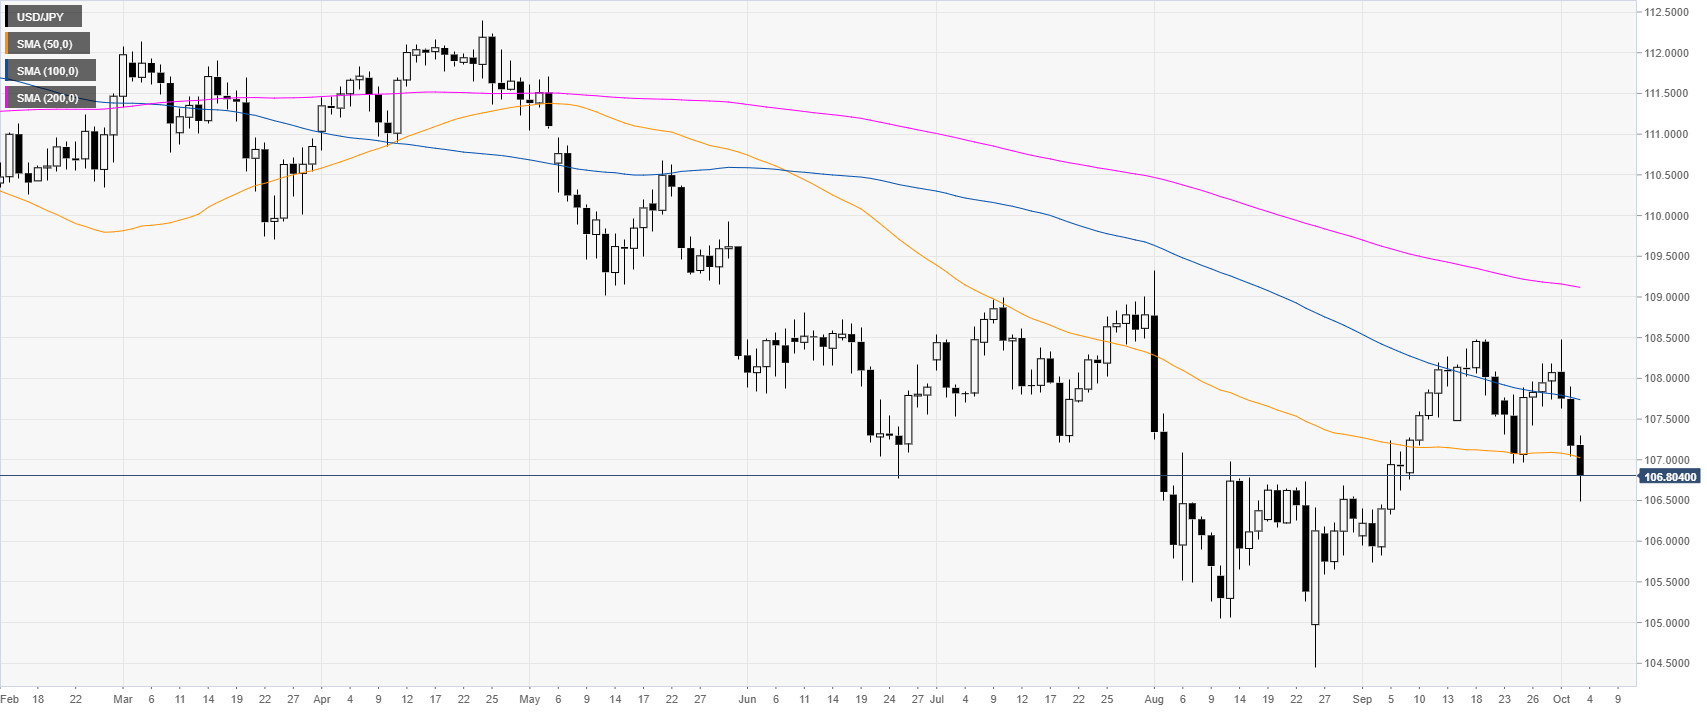
 

USD/JPY daily chart


USD/JPY is trading in a bear trend below the main simple moving averages (SMAs). The Greenback is on the back foot after worse-than-expected ISM PMI data from the United States this week. 


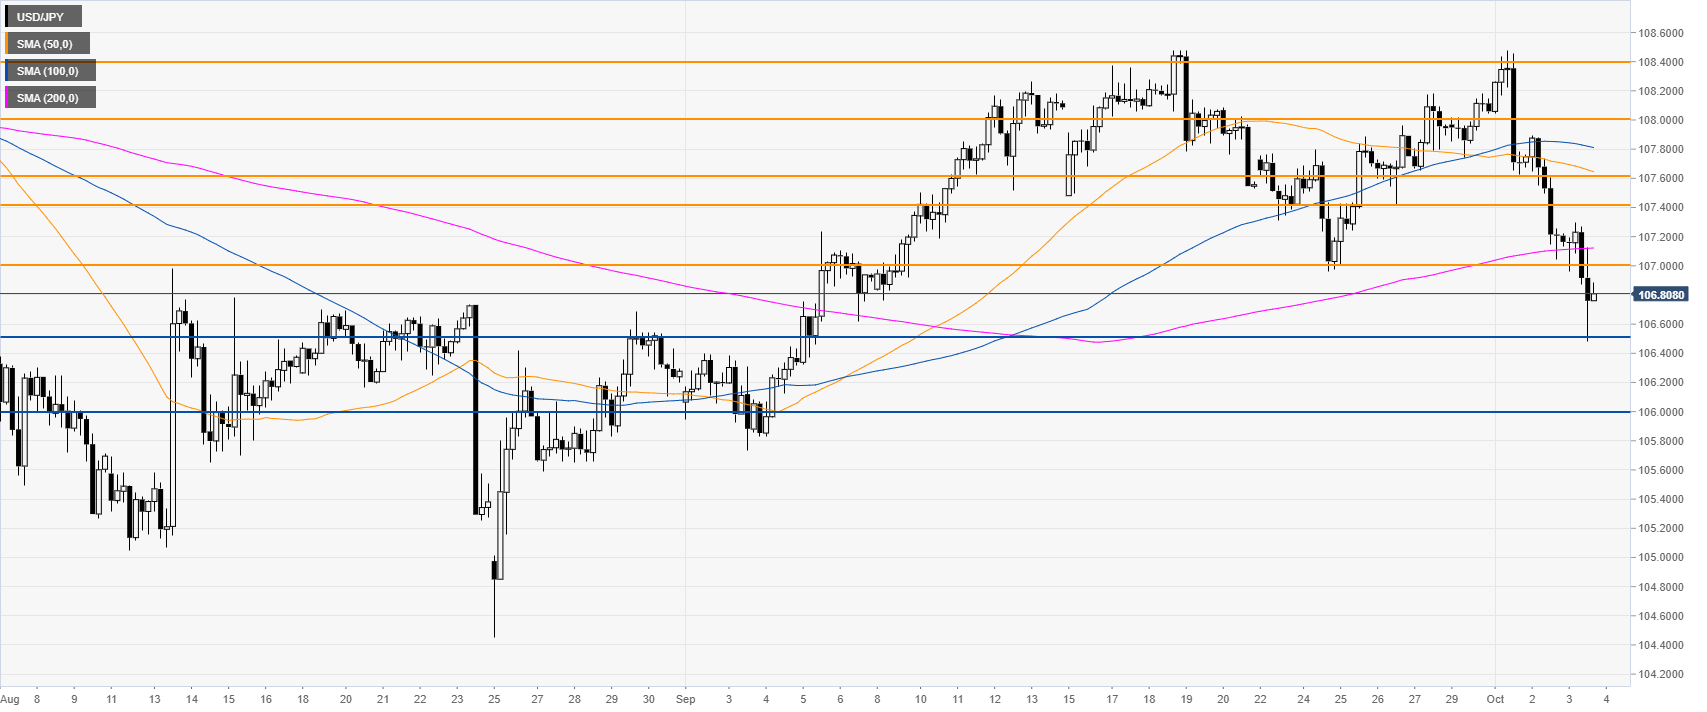
USD/JPY four-hour chart


USD/JPY is under pressure below the 107.00 figure and the 200 SMA. A break below the 106.50 support can expose the 106.00 handle to the downside, according to the Technical Confluences Indicator
 

USD/JPY 30-minute chart


The USD/JPY currency pair is under pressure below the main SMAs, suggesting a bearish bias in the near term. Immediate resistances are seen at the 107.00 and 107.40 price levels, according to the Technical Confluences Indicator. 
 

Additional key levels

USD/JPY

Overview
Today last price106.81
Today Daily Change-0.36
Today Daily Change %-0.34
Today daily open107.17
 
Trends
Daily SMA20107.7
Daily SMA50107.06
Daily SMA100107.77
Daily SMA200109.14
 
Levels
Previous Daily High107.9
Previous Daily Low107.04
Previous Weekly High108.18
Previous Weekly Low106.96
Previous Monthly High108.48
Previous Monthly Low105.74
Daily Fibonacci 38.2%107.37
Daily Fibonacci 61.8%107.57
Daily Pivot Point S1106.85
Daily Pivot Point S2106.52
Daily Pivot Point S3106
Daily Pivot Point R1107.7
Daily Pivot Point R2108.22
Daily Pivot Point R3108.55

Author

Flavio Tosti

Flavio Tosti

Independent Analyst


More from Flavio Tosti
Share:

Editor's Picks

EUR/USD weakens as US jobs data trims Fed rate cut bets

The EUR/USD pair trades in negative territory for the third consecutive day near 1.1860 during the early European session on Thursday. Traders will keep an eye on the US weekly Initial Jobless Claims data. On Friday, the attention will shift to the US Consumer Price Index inflation report. 

GBP/USD bullish outlook prevails above 1.3600, UK GDP data looms

The GBP/USD pair gains ground near 1.3635, snapping the two-day losing streak during the early European session on Thursday. The preliminary reading of UK Gross Domestic Product for the fourth quarter will be closely watched later on Thursday. The UK economy is estimated to grow 0.2% QoQ in Q4, versus 0.1% in Q1. 

Gold remains on the defensive below two-week top; lacks bearish conviction amid mixed cues

Gold sticks to modest intraday losses through the Asian session on Thursday, though it lacks follow-through selling and remains close to a nearly two-week high, touched the previous day. The commodity currently trades above the $5,070 level, down just over 0.20% for the day, amid mixed cues.

UK GDP set to post weak growth as markets rise bets on March rate cut

Markets will be watching closely on Thursday, when the United Kingdom’s Office for National Statistics will release the advance estimate of Q4 Gross Domestic Product. If the data land in line with consensus, the UK economy would have continued to grow at an annualised pace of 1.2%, compared with 1.3% recorded the previous year. 

The market trades the path not the past

The payroll number did not just beat. It reset the tone. 130,000 vs. 65,000 expected, with a 35,000 whisper. 79 of 80 economists leaning the wrong way. Unemployment and underemployment are edging lower. For all the statistical fog around birth-death adjustments and seasonal quirks, the core message was unmistakable. The labour market is not cracking.

XRP sell-off deepens amid weak retail interest, risk-off sentiment

Ripple (XRP) is edging lower around $1.36 at the time of writing on Wednesday, weighed down by low retail interest and macroeconomic uncertainty, which is accelerating risk-off sentiment.