|
USD/JPY technical analysis: Greenback holds onto weekly gains against Yen near 108.00 handle
- USD/JPY holds onto weekly gains despite broad-based USD weakness.
- The levels to beat for buyers is the 108.24 resistance level.

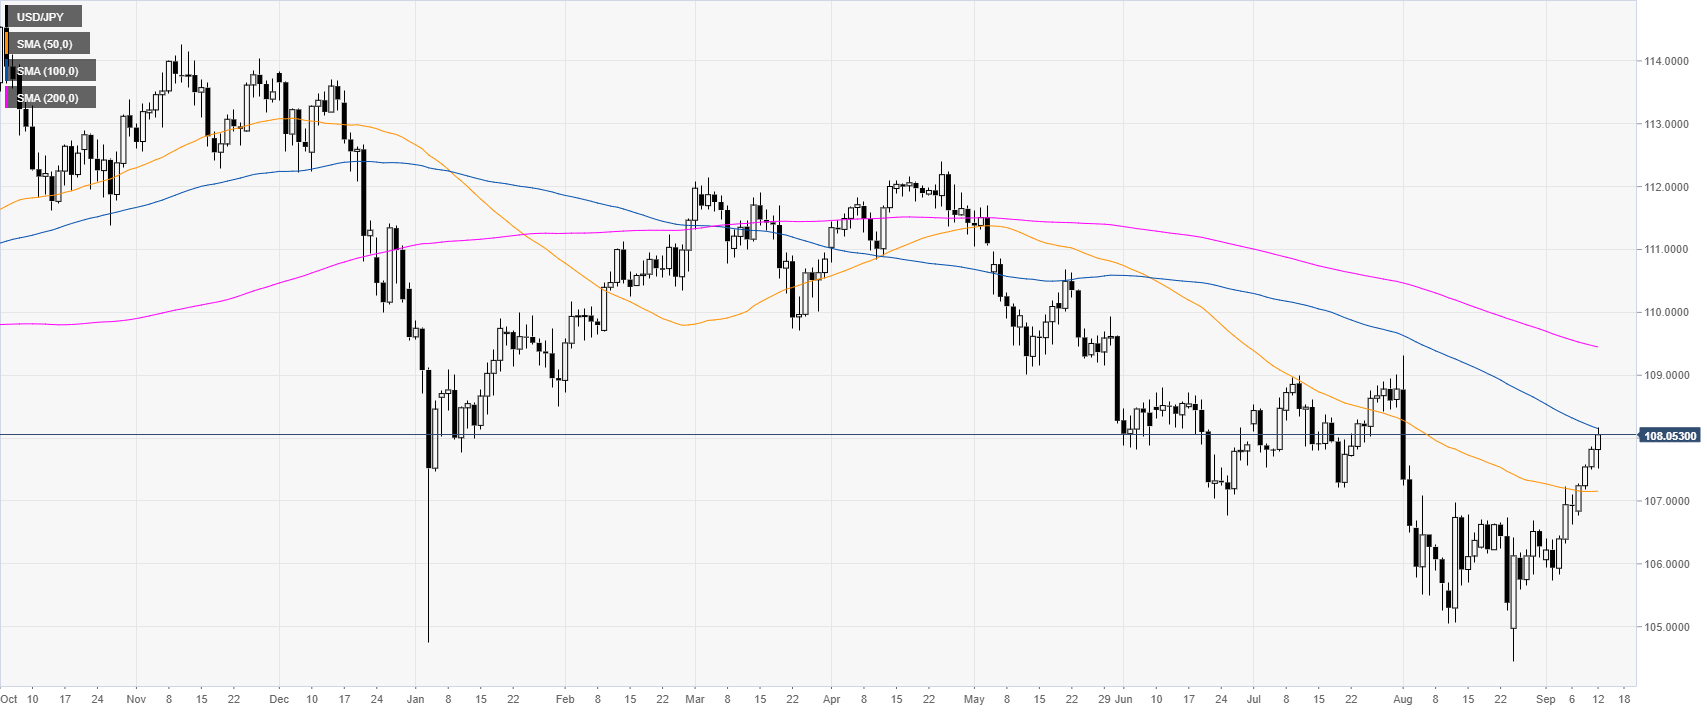
USD/JPY daily chart
USD/JPY is trading in a bear trend below its 100 and 200-day simple moving averages (DSMAs). However, since August the market has been rebounding sharply now challenging the 108.00 figure.
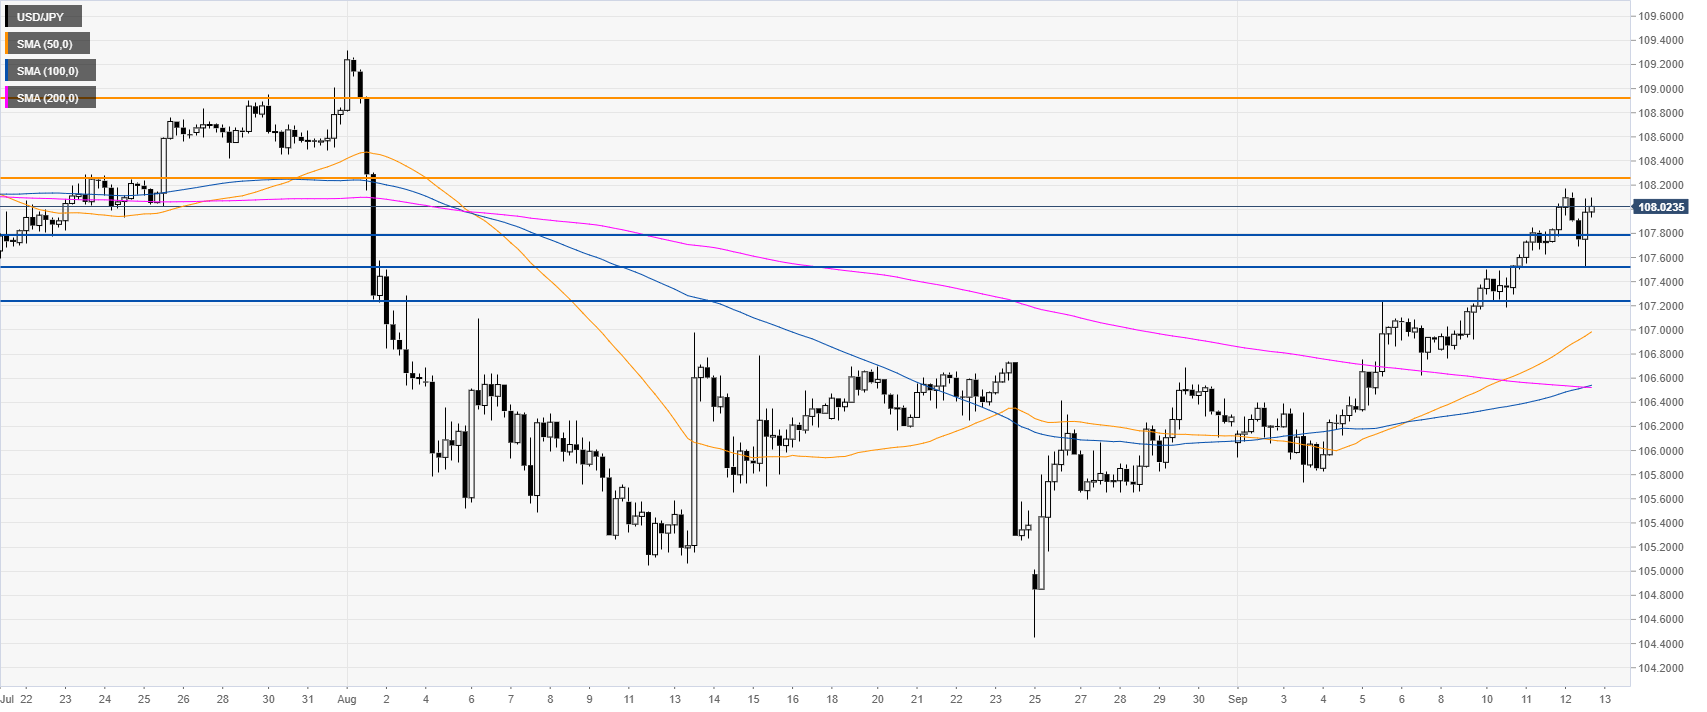
USD/JPY 4-hour chart
USD/JPY is trading above its main SMAs, suggesting bullish momentum in the medium term. Bulls will be looking for a break beyond the 108.24 resistance in order to set their eyes on the 108.91 resistance level, according to the Technical Confluences Indicator.
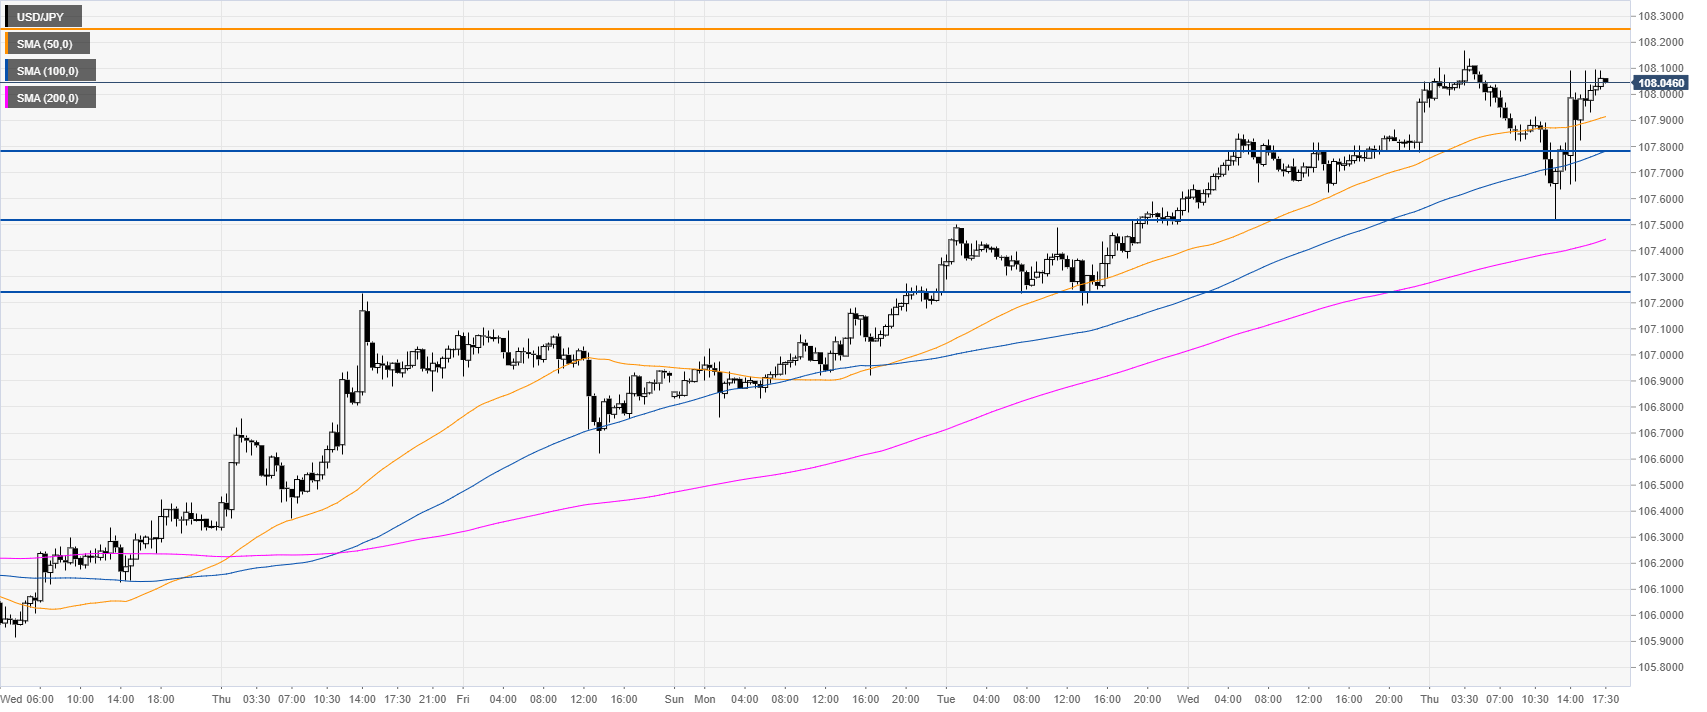
USD/JPY 30-minute chart
Dollar/Yen is trading above the main SMAs, suggesting bullish momentum in the near term. Immediate support is seen at 107.79 level followed by the 107.50 and 107.23 price levels, according to the Technical Confluences Indicator.
Additional key levels
Author

Flavio Tosti
Independent Analyst
More from Flavio Tosti


