|

USD/JPY technical analysis: Greenback hangs near four-day highs after FOMC Minutes

  • USD/JPY is trading at daily highs above the 107.40 resistance.
  • The FOMC Minutes as Fed's Powell reiterated what most investors already knew. 
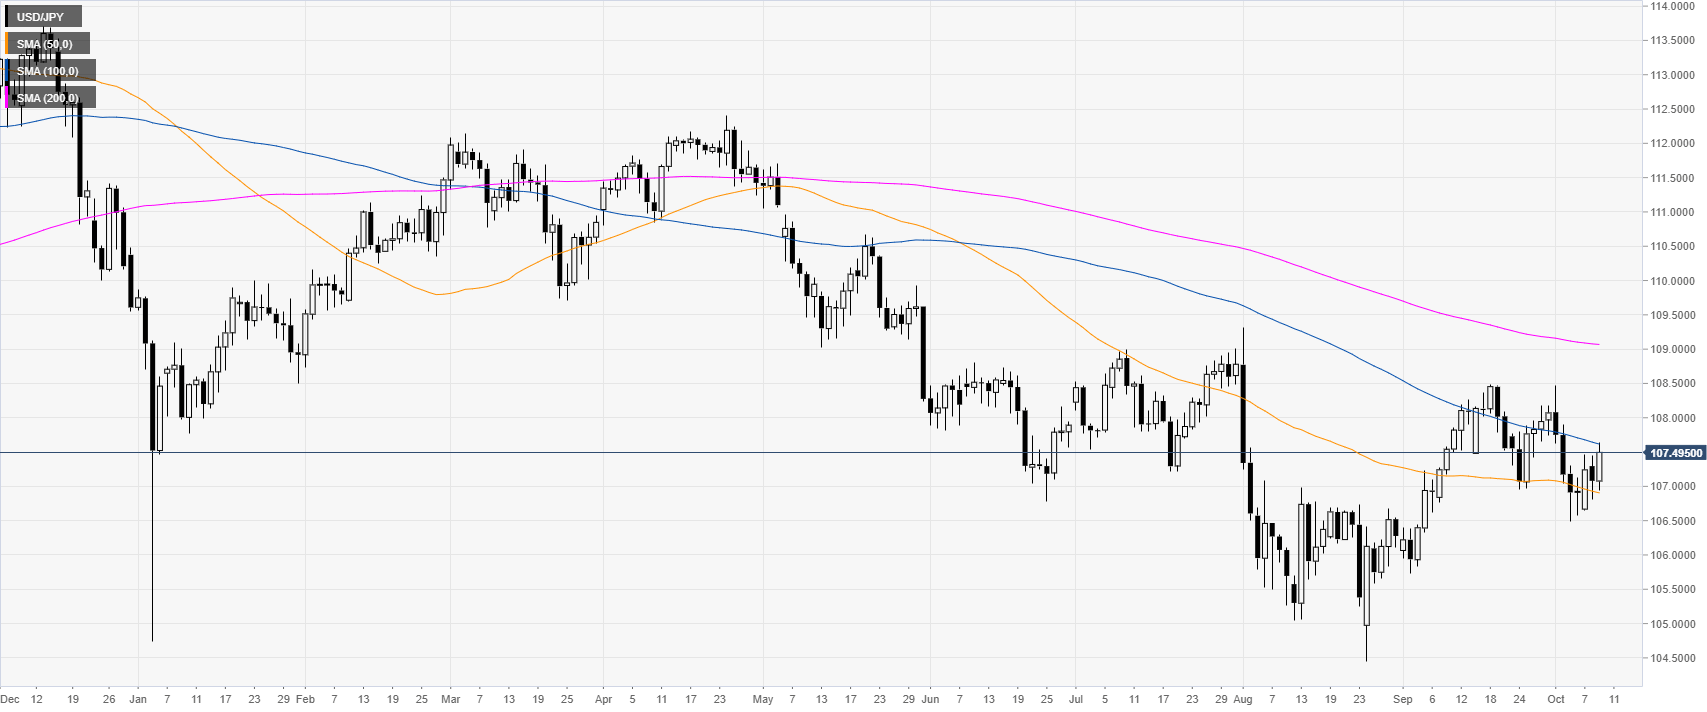
 

USD/JPY daily chart


The USD/JPY exchange rate is trading in a bear trend below its 100 and 200-day simple moving averages (DSMAs). However, the spot is attempting to find some support near the 50 SMA at the 106.90 level. The FOMC Minutes were a non-event with little market reaction. Chief’s Powell reiterated what most market players already know: “risks come from abroad, chances of a recession are limited and the economy overall is healthy.”


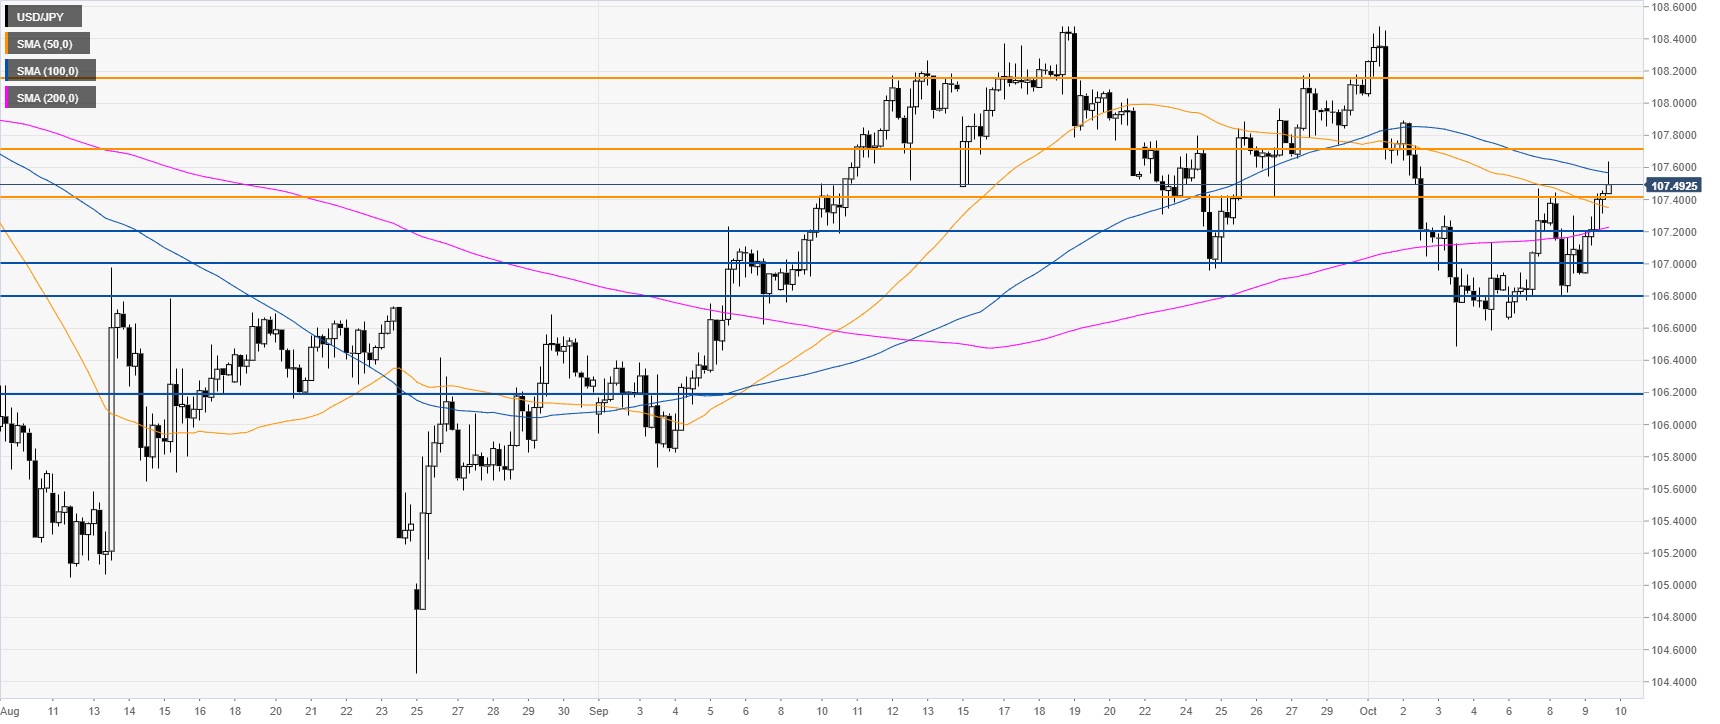
USD/JPY four-hour chart


USD/JPY is settling above the 107.40 resistance while challenging the 100 SMA on the four-hour chart. The market might try to reach 107.70 resistance on the way up, according to the Technical Confluences Indicator. A break of the level can expose 108.16 resistance if the bulls gather enough steam.
 

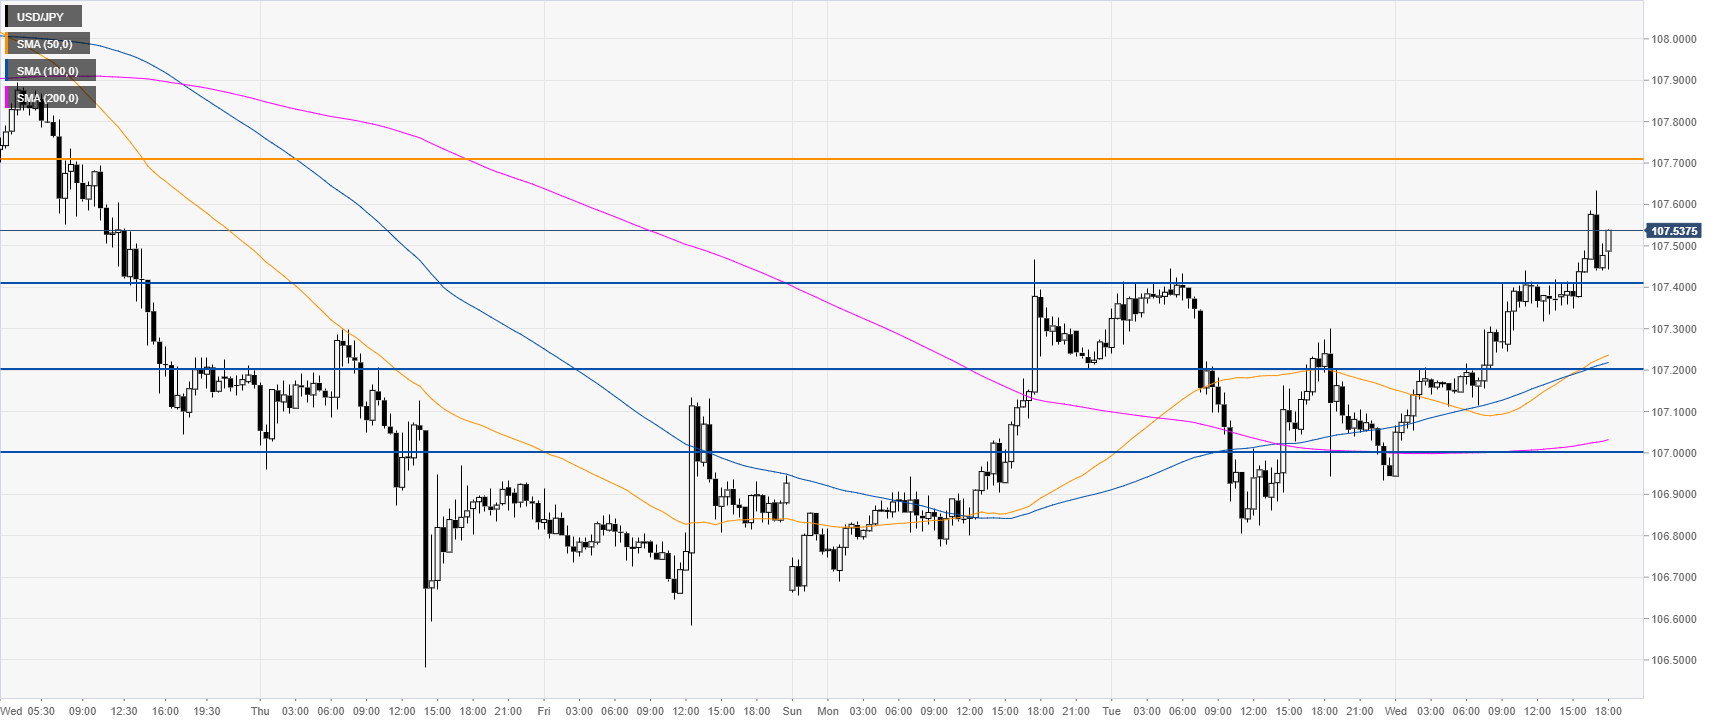
USD/JPY 30-minute chart


The USD/JPY currency pair is trading above the main SMAs, suggesting bullish momentum in the near term. Immediate supports are seen at the 107.40/20 support zone and 107.00 figure, according to the Technical Confluences Indicator. 
 

Additional key levels

USD/JPY

Overview
Today last price107.5
Today Daily Change0.42
Today Daily Change %0.39
Today daily open107.08
 
Trends
Daily SMA20107.68
Daily SMA50106.93
Daily SMA100107.64
Daily SMA200109.08
 
Levels
Previous Daily High107.45
Previous Daily Low106.8
Previous Weekly High108.48
Previous Weekly Low106.48
Previous Monthly High108.48
Previous Monthly Low105.74
Daily Fibonacci 38.2%107.05
Daily Fibonacci 61.8%107.2
Daily Pivot Point S1106.78
Daily Pivot Point S2106.47
Daily Pivot Point S3106.13
Daily Pivot Point R1107.42
Daily Pivot Point R2107.75
Daily Pivot Point R3108.06

Author

Flavio Tosti

Flavio Tosti

Independent Analyst


More from Flavio Tosti
Share:

Editor's Picks

EUR/USD flirts with weekly lows near 1.1770

EUR/USD now comes under further selling pressure, breaking below the 1.1800 support to challenge the area of weekly throughs near 1.1770 on Thursday. The pair’s decline comes in response to marked gains in the US Dollar amid steady geopolitical tensions. Ealier in the day, the ECB’s Lagarde delivered cautious remarks, although the currency remained apathetic.

GBP/USD threatens the 200-day SMA near 1.3440

GBP/USD rapidly leaves behind Wednesday’s strong advance, coming under heavy pressure and retesting the 1.3440 zone, where the critical 200-day SMA is located. Cable’s deep pullback follows the strong gains in the Greenback, while investors continue to pencil in a potential BoE rate cut in March.

Gold trims gains, slips back to around $5,170

Gold is now facing some downside pressure, hovering around the $5,170 region on Thursday. The yellow metal surrenders part of its earlier gains on the back of the resurgence of the buying interest in the Greenback. In the meantime, geopolitical tensions in the Middle East continue to limit the downside potential for now.

Stellar: Relief bounce fades as bearish undertone persists

Stellar is trading around $0.16 at the time of writing on Thursday after rebounding more than 8% in the previous day. Derivatives data paints a negative picture as XLM’s short bets hit a monthly high while Open Interest continues to decline.

Changing the game: International implications of recent tariff developments

The Supreme Court ruling on International Emergency Economic Powers Act (IEEPA) tariffs provides limited relief for the rest of the world, with weighted average tariff rates modestly lower.

Bitcoin steadies as traders eye US–Iran talks

Bitcoin (BTC) price is stabilizing around $68,000 at the time of writing on Thursday after a 6.2% relief rally the previous day amid a broader downward trend.