USD/JPY Technical Analysis: Greenback breaks below 113.00 against Yen as Wall Street bears take over

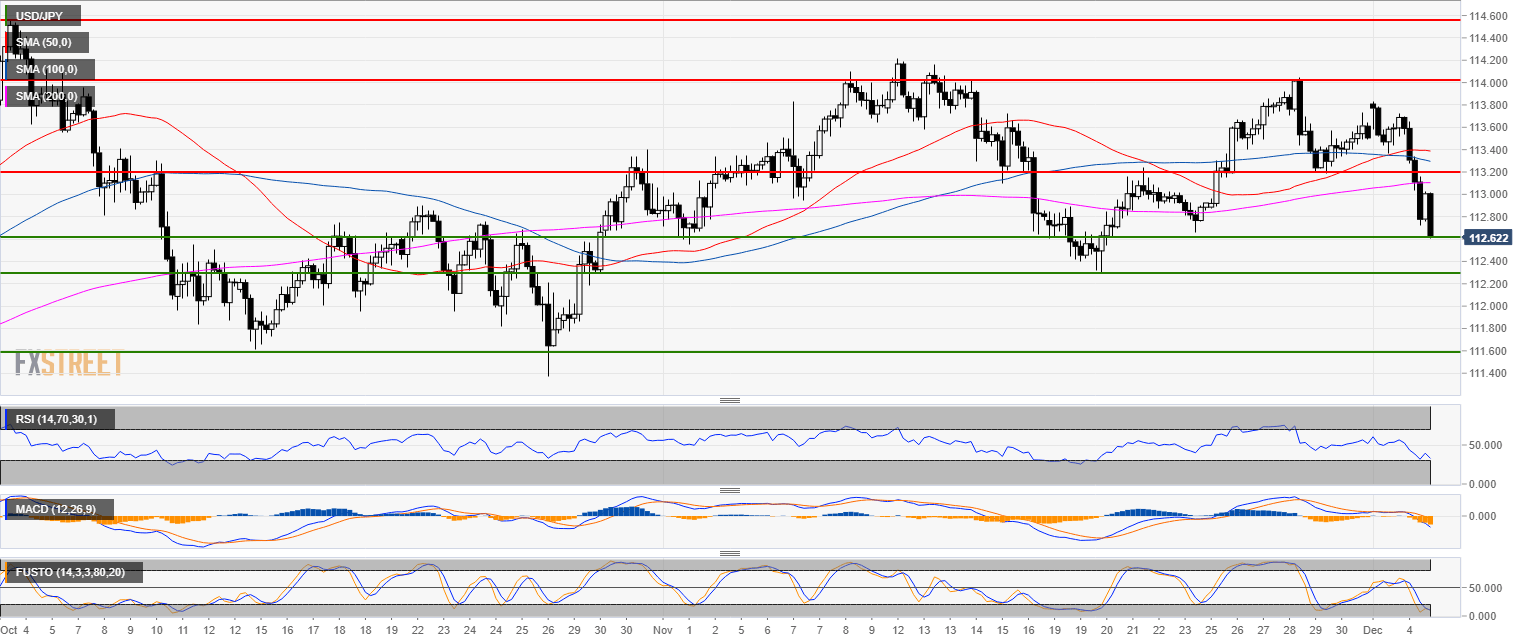
USD/JPY daily chart
- USD/JPY is trading in a bull trend above the 100 and 200-day simple moving averages (SMAs).
- USD/JPY broke below the 50 SMA and the 113.00 figure.
- There is safe-haven demand for the Japanse Yen as US stock indices are trading down.
-636795456527885665.png)
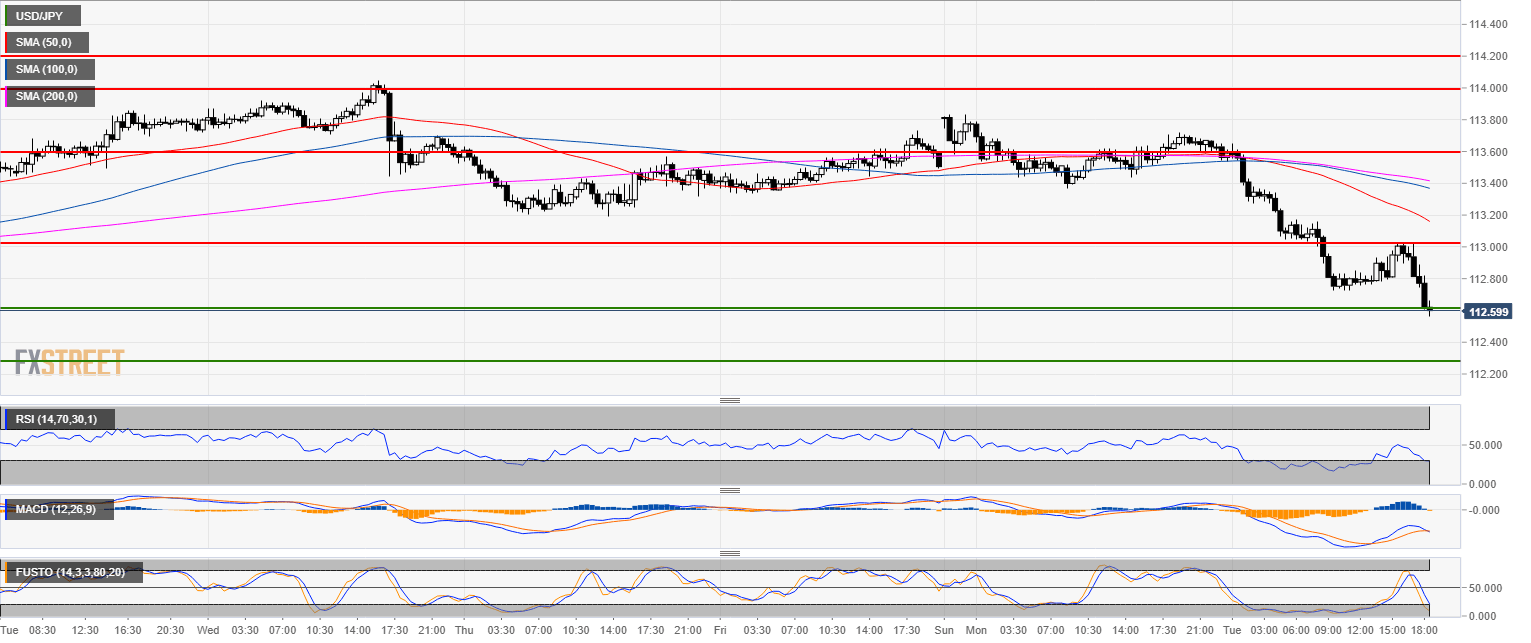
USD/JPY 4-hour chart
- USD/JPY reached the 112.60 support.
- Bears would need to break through it in order to reach the 112.30 and 111.60 level.
USD/JPY 30-minute chart
- 113.00 becomes strong resistance to the upside.
- The path of least resistance is down but 112.60 needs to be broken.
Additional key levels
USD/JPY
Overview:
Today Last Price: 112.62
Today Daily change: -1.0e+2 pips
Today Daily change %: -0.915%
Today Daily Open: 113.66
Trends:
Previous Daily SMA20: 113.4
Previous Daily SMA50: 113.08
Previous Daily SMA100: 112.25
Previous Daily SMA200: 110.46
Levels:
Previous Daily High: 113.83
Previous Daily Low: 113.37
Previous Weekly High: 114.04
Previous Weekly Low: 112.88
Previous Monthly High: 114.25
Previous Monthly Low: 112.3
Previous Daily Fibonacci 38.2%: 113.55
Previous Daily Fibonacci 61.8%: 113.65
Previous Daily Pivot Point S1: 113.41
Previous Daily Pivot Point S2: 113.17
Previous Daily Pivot Point S3: 112.96
Previous Daily Pivot Point R1: 113.87
Previous Daily Pivot Point R2: 114.07
Previous Daily Pivot Point R3: 114.32
Author

Flavio Tosti
Independent Analyst


