|

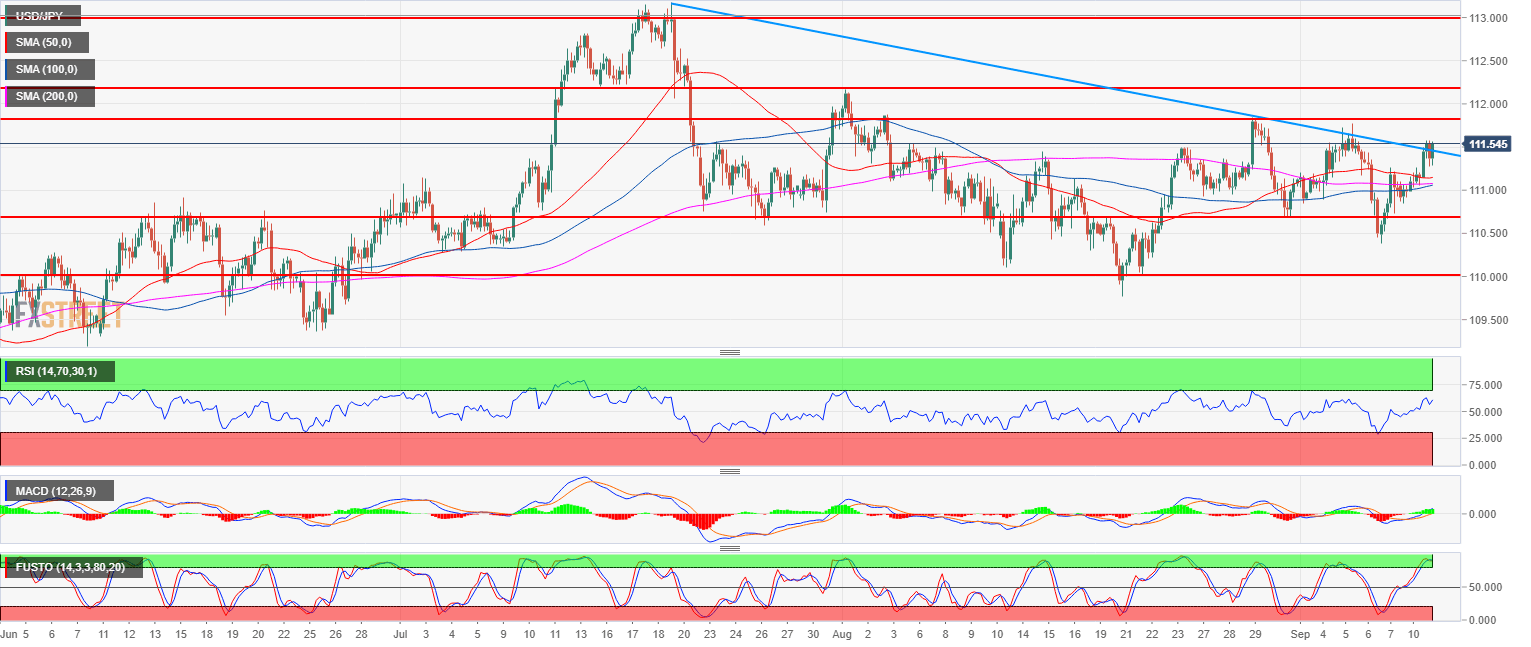
USD/JPY Technical Analysis: Bulls eager to break above 112.00 figure

  • USD/JPY main bull trend is taking a breather since mid-July as the market has entered a trading range.
  • USD/JPY bulls are trying to break above the bear trendline from July 17 but they will also have to break above the 112.00-112.17 zone (figure and August 1, swing high) if they wish to resume the bull trend. The RSI, MACD and Stochastics indicators remain constructive to the upside. 
  • However, the 50, 100 and 200-period simple moving averages are flat suggesting that there is not yet convincing momentum in the market.

USD/JPY 4-hour chart

Spot rate:                 111.53
Relative change:      0.38%     
High:                        111.58
Low:                         110.05

Main trend:               Bullish 
Short-term trend:      Neutral

Resistance 1:    111.54 August 6, high 
Resistance 2:    111.84 August 29 swing high
Resistance 3:    112.00-112.17 zone, figure and August 1, swing high
Resistance 4:    112.40 supply level
Resistance 5:    113.18, 2018 high

Support 1:    111.45 August 8 high
Support 2:    111.00 figure
Support 3:    110.75, July 23 swing low
Support 4:    110.00 figure
Support 5:    109.37 June 25 low

Author

Flavio Tosti

Flavio Tosti

Independent Analyst


More from Flavio Tosti
Share:

Markets move fast. We move first.

Orange Juice Newsletter brings you expert driven insights - not headlines. Every day on your inbox.

By subscribing you agree to our Terms and conditions.

Editor's Picks

EUR/USD struggles for direction amid USD gains

EUR/USD is trimming part of its earlier gains, coming under some mild downside pressure near 1.1730 as the US Dollar edges higher. Markets are still digesting the Fed’s latest rate decision, while also looking ahead to more commentary from Fed officials in the sessions ahead.

GBP/USD drops to daily lows near 1.3360

Disappointing UK data weighed on the Sterling towards the end of the week, triggering a pullback in GBP/USD to fresh daily lows near 1.3360. Looking ahead, the next key event across the Channel is the BoE meeting on December 18.

Gold losses momentum, challenges $4,300

Gold now gives away some gains and disputes the key $4,300 zone per troy ounce following earlier multi-week highs. The move is being driven by expectations that the Fed will deliver further rate cuts next year, with the yellow metal climbing despite a firmer Greenback and rising US Treasury yields across the board.

Litecoin Price Forecast: LTC struggles to extend gains, bullish bets at risk

Litecoin (LTC) price steadies above $80 at press time on Friday, following a reversal from the $87 resistance level on Wednesday. Derivatives data suggests a bullish positional buildup while the LTC futures Open Interest declines, flashing a long squeeze risk.

Big week ends with big doubts

The S&P 500 continued to push higher yesterday as the US 2-year yield wavered around the 3.50% mark following a Federal Reserve (Fed) rate cut earlier this week that was ultimately perceived as not that hawkish after all. The cut is especially boosting the non-tech pockets of the market.

Aave Price Forecast: AAVE primed for breakout as bullish signals strengthen

Aave (AAVE) price is trading above $204 at the time of writing on Friday and approaching the upper boundary of its descending parallel channel; a breakout from this structure would favor the bulls.