USD/JPY Price Prediction: Pulls back after breaking out of price pattern
- USD/JPY pulls back after breaking out of a bearish price pattern.
- The pair is still in a bear trend, however and likely to continue lower.

USD/JPY pulls back after breaking out of a bearish Broadening Formation (BF) pattern and pulls back to the 50-day Simple Moving Average (SMA). The pair is probably in a short-term downtrend which is more likely than not to extend.
The first downside target lies at 148.54, the 61.8% Fibonacci extrapolation of the height of the pattern extrapolated lower.
USD/JPY Daily Chart
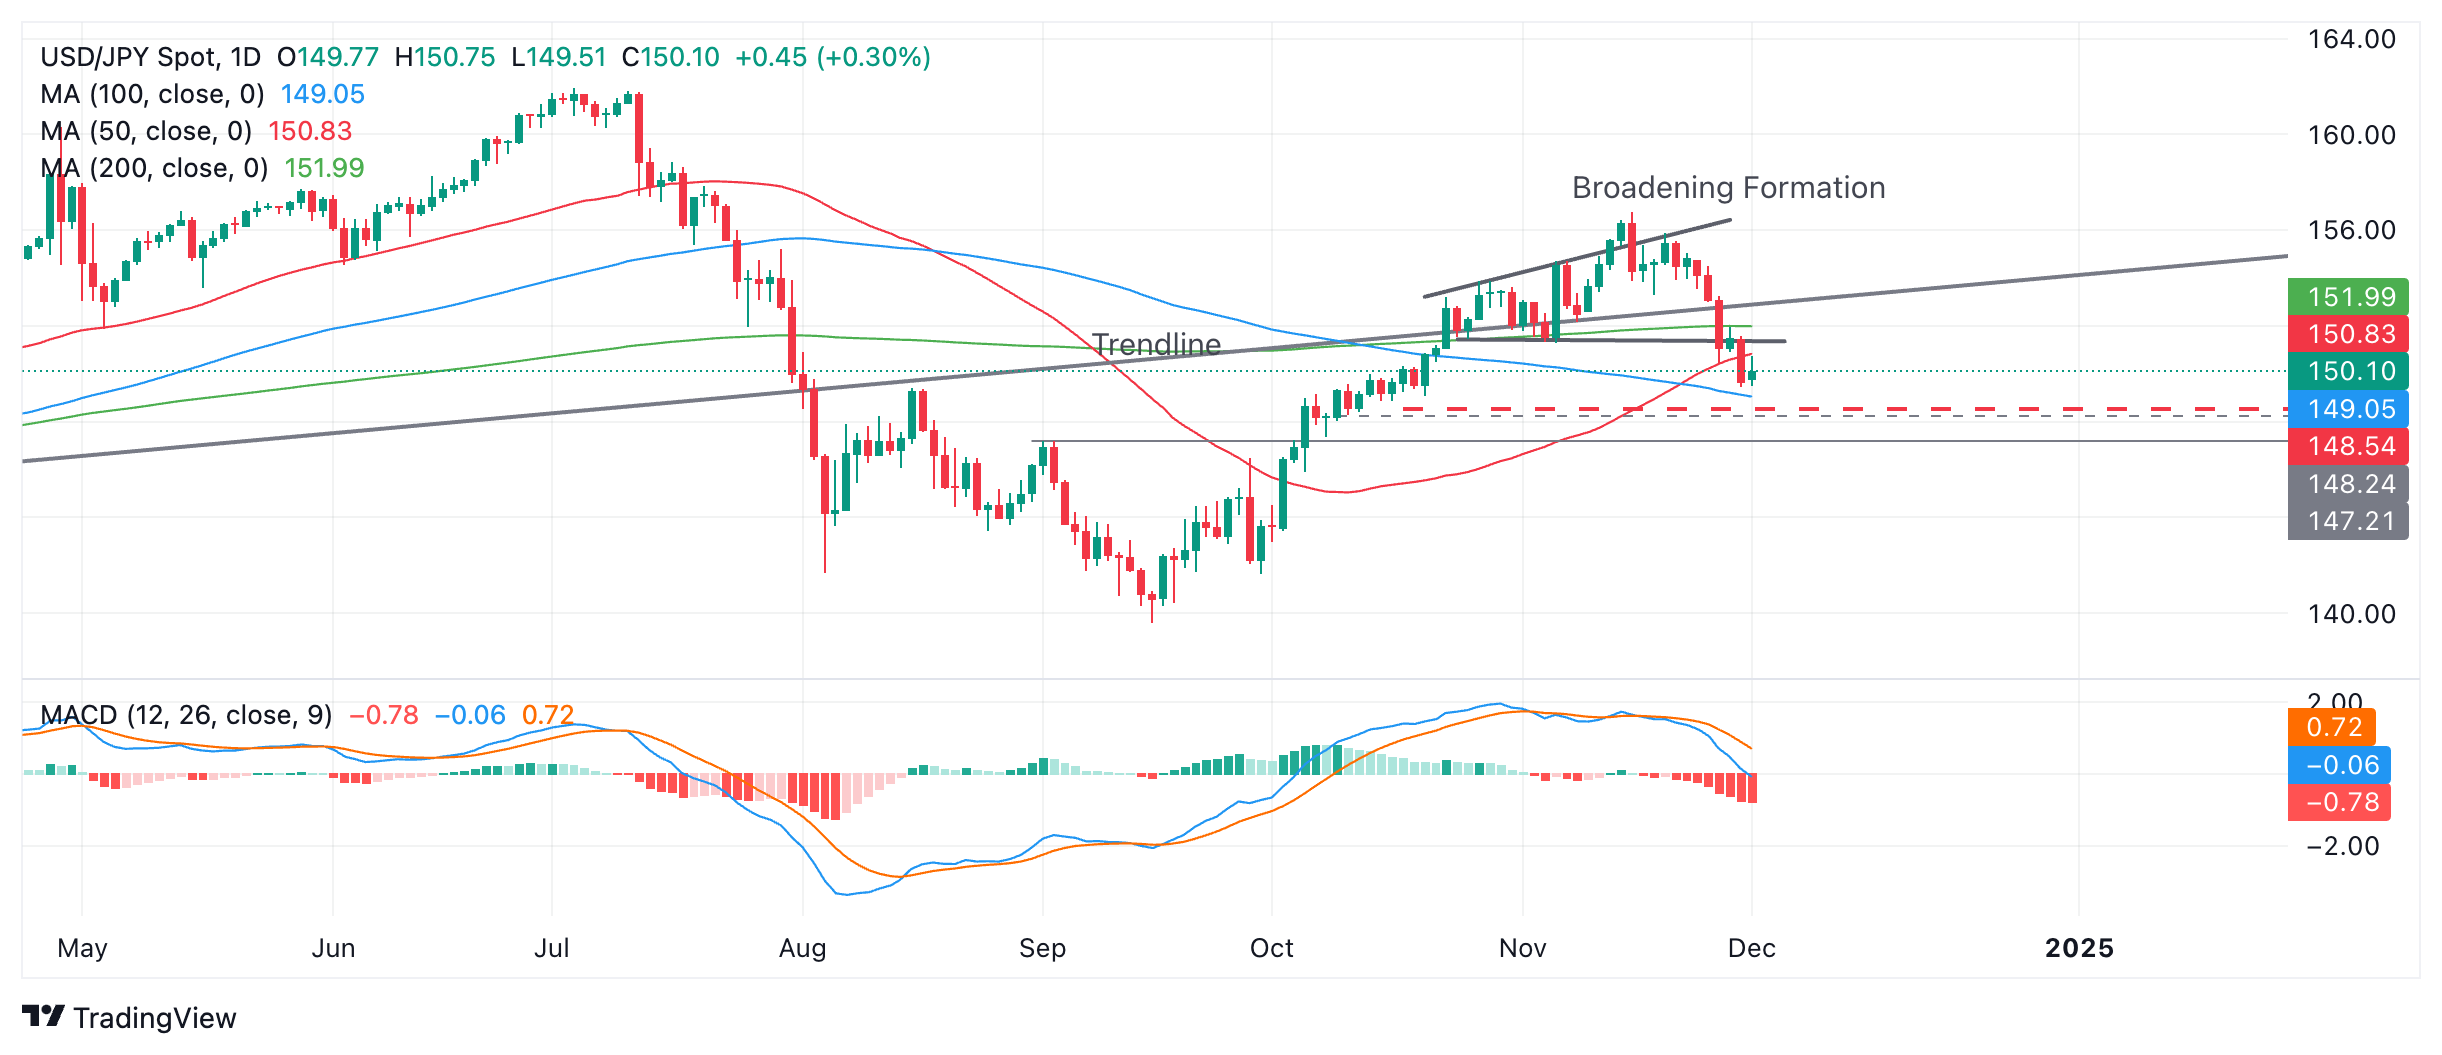
Further bearishness could carry USD/JPY to the next target at 148.24, the September 2, key swing high.
The (blue) Moving Average Convergence Divergence (MACD) momentum indicator is diverging away from its red signal line which is bearish and has fallen below the zero line on an intraday basis. If it closes below zero then it will increase the bearishness of the indicator reading.
Author

Joaquin Monfort
FXStreet
Joaquin Monfort is a financial writer and analyst with over 10 years experience writing about financial markets and alt data. He holds a degree in Anthropology from London University and a Diploma in Technical analysis.


