|

USD/JPY Price Prediction: Falls to base of Broadening Formation, threatens breakdown

  • USD/JPY has fallen to the base of a bearish price pattern. 
  • The pair has bounced but remains vulnerable to further downside. 

USD/JPY has fallen to the base of a bearish Broadening Formation price pattern and the 50-day Simple Moving Average (SMA) just below at 150.59, and bounced.

USD/JPY Daily Chart 

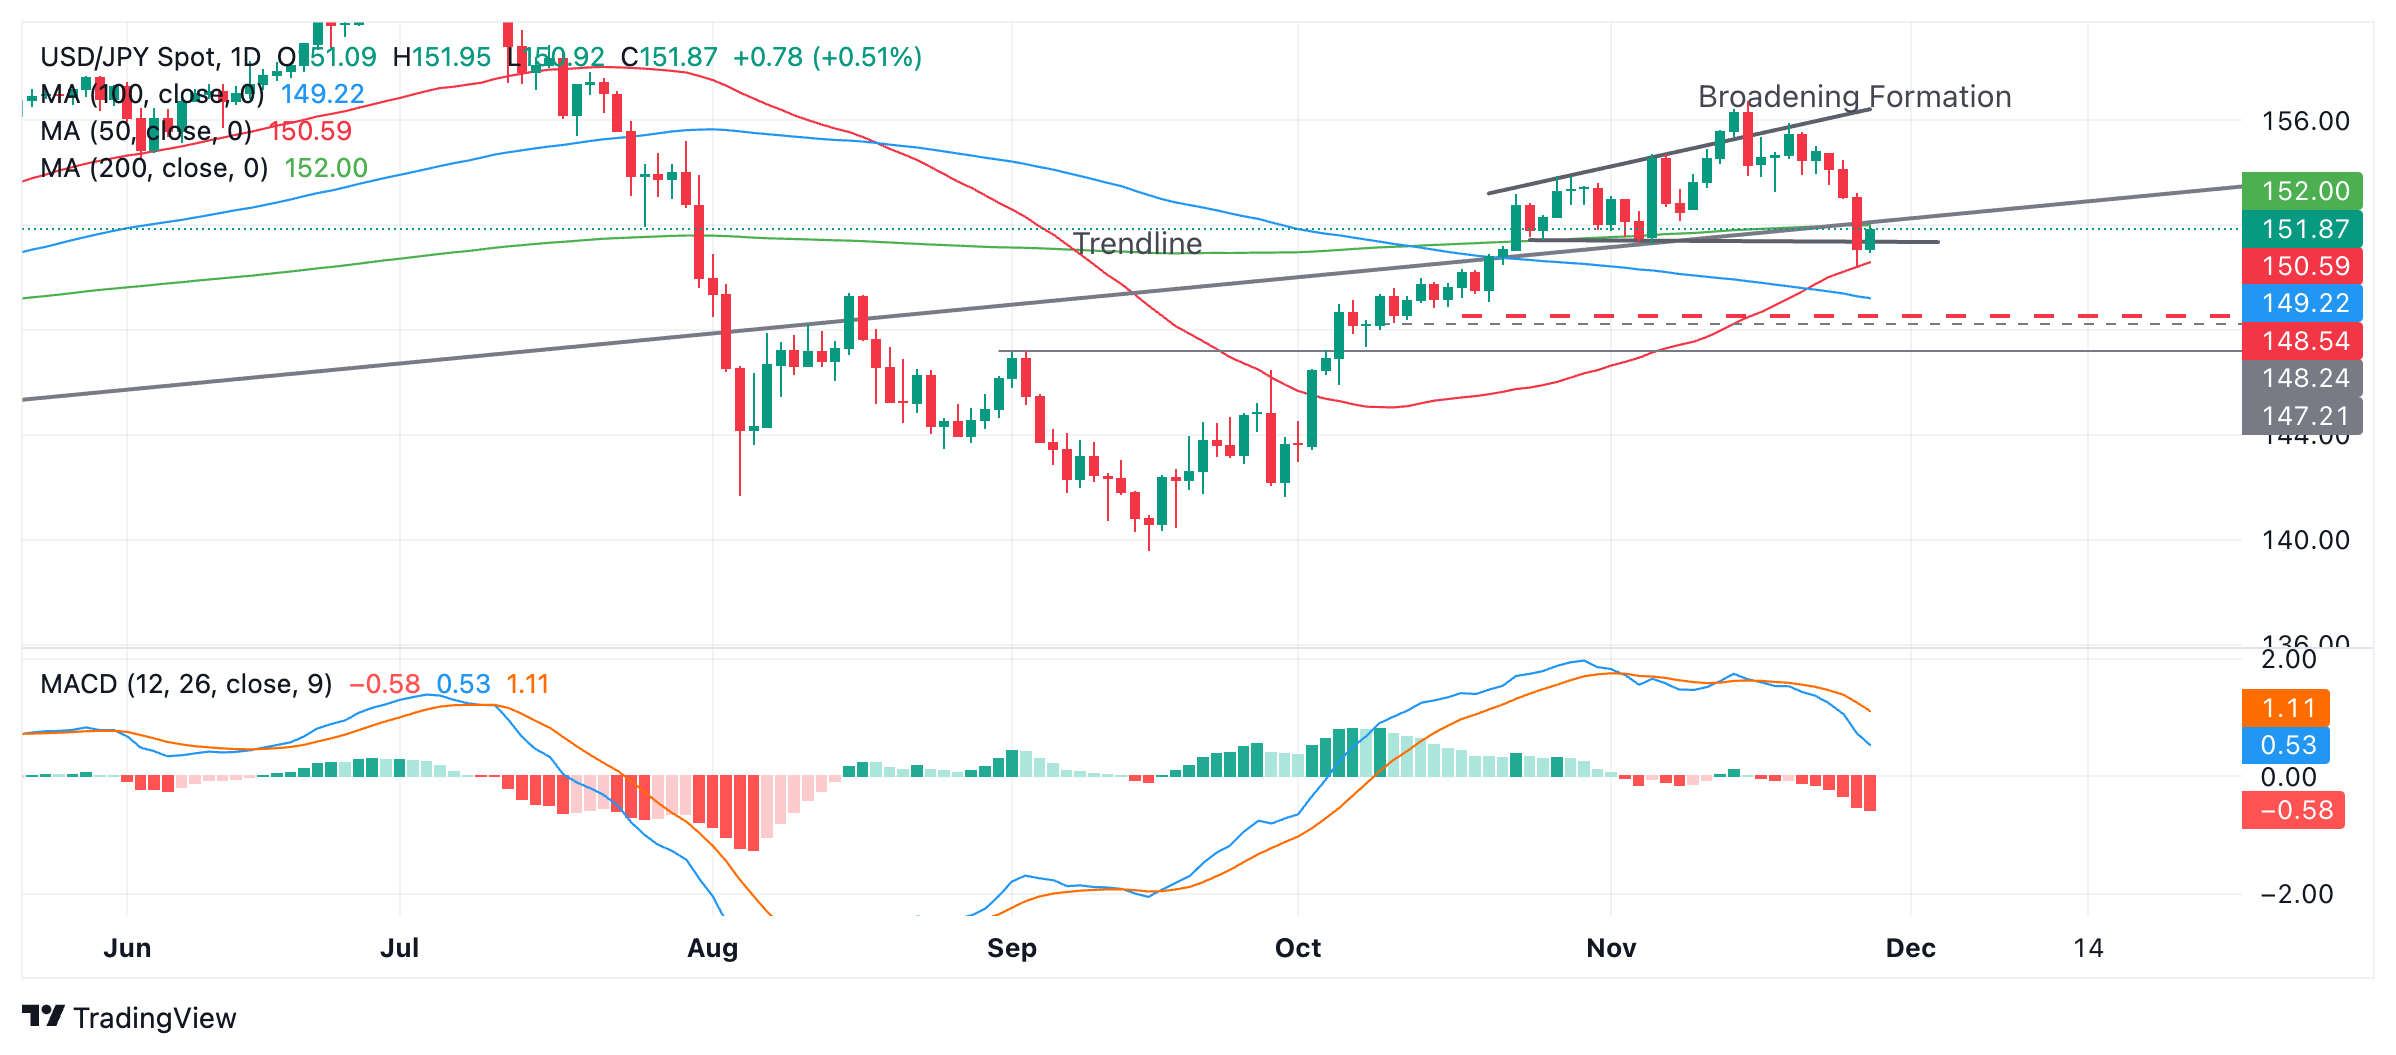
A break below the 150.46 November 27 low would cement the breakdown from the pattern and probably lead to more downside toward 148.54, the downside target for the pattern, followed by 148.24 the September 2, key swing high.

The (blue) Moving Average Convergence Divergence (MACD) momentum indicator recently crossed below the red signal line and they are diverging – a bearish indication. 

It is possible the pattern may not have finished forming yet in which case it could be in the process of beginning a new up leg within the boundary lines. This could either rally about half way up before pettering out, or all the way up to the top of the pattern in the 156.00s. It is still too early to say whether either of these outcomes is likely to be the case. 

Author

Joaquin Monfort

Joaquin Monfort is a financial writer and analyst with over 10 years experience writing about financial markets and alt data. He holds a degree in Anthropology from London University and a Diploma in Technical analysis.

More from Joaquin Monfort
Share:

Markets move fast. We move first.

Orange Juice Newsletter brings you expert driven insights - not headlines. Every day on your inbox.

By subscribing you agree to our Terms and conditions.

Editor's Picks

EUR/USD struggles for direction amid USD gains

EUR/USD is trimming part of its earlier gains, coming under some mild downside pressure near 1.1730 as the US Dollar edges higher. Markets are still digesting the Fed’s latest rate decision, while also looking ahead to more commentary from Fed officials in the sessions ahead.

GBP/USD drops to daily lows near 1.3360

Disappointing UK data weighed on the Sterling towards the end of the week, triggering a pullback in GBP/USD to fresh daily lows near 1.3360. Looking ahead, the next key event across the Channel is the BoE meeting on December 18.

Gold losses momentum, challenges $4,300

Gold now gives away some gains and disputes the key $4,300 zone per troy ounce following earlier multi-week highs. The move is being driven by expectations that the Fed will deliver further rate cuts next year, with the yellow metal climbing despite a firmer Greenback and rising US Treasury yields across the board.

Litecoin Price Forecast: LTC struggles to extend gains, bullish bets at risk

Litecoin (LTC) price steadies above $80 at press time on Friday, following a reversal from the $87 resistance level on Wednesday. Derivatives data suggests a bullish positional buildup while the LTC futures Open Interest declines, flashing a long squeeze risk.

Big week ends with big doubts

The S&P 500 continued to push higher yesterday as the US 2-year yield wavered around the 3.50% mark following a Federal Reserve (Fed) rate cut earlier this week that was ultimately perceived as not that hawkish after all. The cut is especially boosting the non-tech pockets of the market.

Aave Price Forecast: AAVE primed for breakout as bullish signals strengthen

Aave (AAVE) price is trading above $204 at the time of writing on Friday and approaching the upper boundary of its descending parallel channel; a breakout from this structure would favor the bulls.