- USD/JPY downtrend persists, with the RSI favoring sellers ahead of the Fed's rate cut decision.
- A 25-bps Fed rate cut could push USD/JPY higher toward 142.47, with potential to target the 143.00 figure.
- A 50-bps cut could lead to a retest of 140.32, with further downside aiming for the YTD low of 139.58.
The USD/JPY dropped after reaching a four-day high of 142.47, yet it remains range-bound during the North American session. The rise in US Treasury yields and a soft US Dollar keeps the pair trapped within the September 17 trading range. Therefore, the major trades at 141.88, losses 0.36%
USD/JPY Price Forecast: Technical outlook
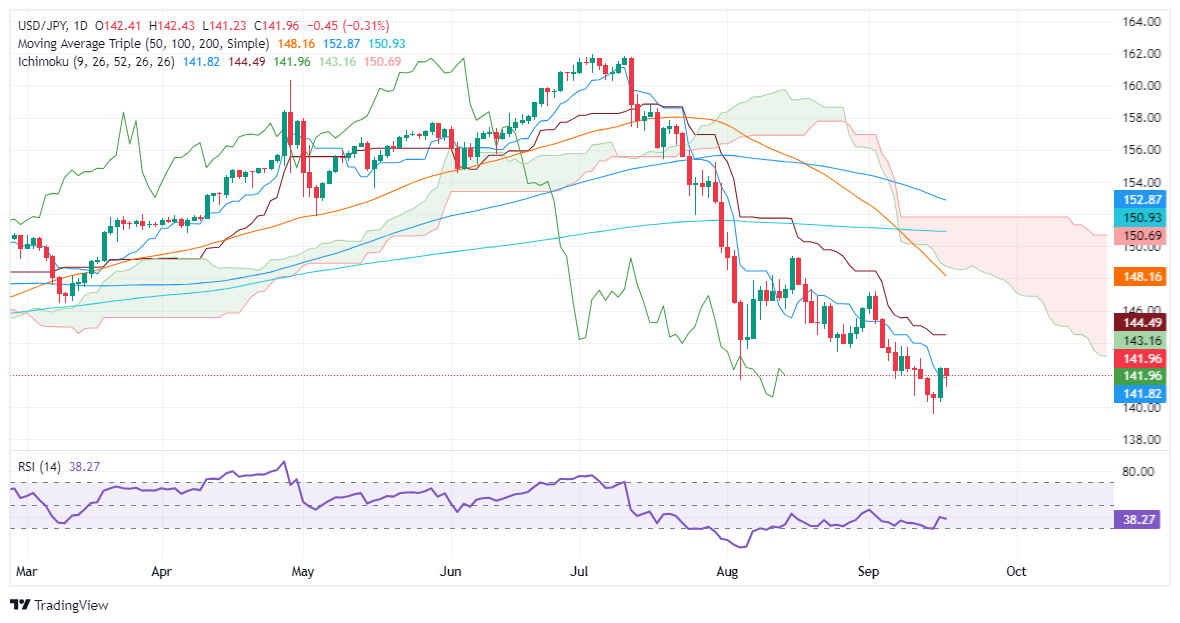
The USD/JPY downtrend remains in place, but the Federal Reserve’s decision to cut rates by a smaller or larger size could trigger different reactions. The Relative Strength Index (RSI) favors sellers, hence further downside.
If the Fed lowers rates by 25 basis points, this could be bullish for the USD/JPY and push prices toward the September 17 high at 142.47, which, if cleared, will expose the 143.00 figure.
On the other hand, a 50 bps rate cut could allow the September 17 low of 140.32 to be retested and pave the way for the challenge of the year-to-date (YTD) low of 139.58.
USD/JPY Price Action – Daily Chart
Japanese Yen PRICE Today
The table below shows the percentage change of Japanese Yen (JPY) against listed major currencies today. Japanese Yen was the strongest against the US Dollar.
USD | EUR | GBP | JPY | CAD | AUD | NZD | CHF | |
---|---|---|---|---|---|---|---|---|
USD | -0.04% | -0.32% | -0.31% | -0.04% | -0.16% | -0.37% | -0.19% | |
EUR | 0.04% | -0.29% | -0.30% | -0.01% | -0.12% | -0.35% | -0.15% | |
GBP | 0.32% | 0.29% | 0.00% | 0.28% | 0.18% | -0.07% | 0.17% | |
JPY | 0.31% | 0.30% | 0.00% | 0.27% | 0.16% | -0.05% | 0.17% | |
CAD | 0.04% | 0.01% | -0.28% | -0.27% | -0.12% | -0.34% | -0.11% | |
AUD | 0.16% | 0.12% | -0.18% | -0.16% | 0.12% | -0.21% | 0.00% | |
NZD | 0.37% | 0.35% | 0.07% | 0.05% | 0.34% | 0.21% | 0.21% | |
CHF | 0.19% | 0.15% | -0.17% | -0.17% | 0.11% | -0.01% | -0.21% |
The heat map shows percentage changes of major currencies against each other. The base currency is picked from the left column, while the quote currency is picked from the top row. For example, if you pick the Japanese Yen from the left column and move along the horizontal line to the US Dollar, the percentage change displayed in the box will represent JPY (base)/USD (quote).
Information on these pages contains forward-looking statements that involve risks and uncertainties. Markets and instruments profiled on this page are for informational purposes only and should not in any way come across as a recommendation to buy or sell in these assets. You should do your own thorough research before making any investment decisions. FXStreet does not in any way guarantee that this information is free from mistakes, errors, or material misstatements. It also does not guarantee that this information is of a timely nature. Investing in Open Markets involves a great deal of risk, including the loss of all or a portion of your investment, as well as emotional distress. All risks, losses and costs associated with investing, including total loss of principal, are your responsibility. The views and opinions expressed in this article are those of the authors and do not necessarily reflect the official policy or position of FXStreet nor its advertisers. The author will not be held responsible for information that is found at the end of links posted on this page.
If not otherwise explicitly mentioned in the body of the article, at the time of writing, the author has no position in any stock mentioned in this article and no business relationship with any company mentioned. The author has not received compensation for writing this article, other than from FXStreet.
FXStreet and the author do not provide personalized recommendations. The author makes no representations as to the accuracy, completeness, or suitability of this information. FXStreet and the author will not be liable for any errors, omissions or any losses, injuries or damages arising from this information and its display or use. Errors and omissions excepted.
The author and FXStreet are not registered investment advisors and nothing in this article is intended to be investment advice.
Recommended content
Editors’ Picks

EUR/USD looks sidelined above 1.1300 ahead of Fedspeak
EUR/USD keeps its marked advance in place above the 1.1300 barrier on Wednesday, buoyed by continued selling pressure on the US Dollar. Lingering trade tensions and fresh worries over US fiscal stability weigh further on the Greenback, while markets turn their focus to upcoming central bank remarks.

GBP/USD keeps the bid stance above 1.3400 on USD-selling
GBP/USD pulls back from the multi-year high near 1.3470 reached earlier in the day but manages well to maintain its bullish bias so far on Wednesday. Latest UK data showed annual CPI inflation surged to 3.5% in April from 2.6% in March, giving the British Pound extra wings.

Gold extends its recovery past $3,300 on US politics... and geopolitics
Gold manages to reclaims the $3,300 mark per troy ounce on Wednesday, driven by mounting fears that Middle East tensions could escalate further Also collaborating with the rebound in the precious metal, the US Dollar remains on the back foot amid persistent debt concerns.

The Fed won’t cut rates soon – bad news for your mortgage loan Premium
The recent surge in US Treasury bond yields after Moody’s cut the credit rating of the United States (US) sovereign debt could be a wake-up call for financial markets, the kind of canary in the coal mine that ends up being remembered as a turnaround signal.

FOMO vs fundamentals: Retail buys the dip, institutional investors stay cautious
Retail optimism is rising, but institutions are still treading carefully amid lingering macro and earnings risks. Policy and fiscal uncertainty remain elevated, with trade tensions, U.S. debt concerns, and a cautious Fed dominating the backdrop.