USD/JPY Price Forecast: Rebounds off weekly lows, bulls target 150.00
- USD/JPY rises from a two-day low of 148.85, gaining strength amid dip-buying and risk-on sentiment.
- The pair remains within the Ichimoku Cloud, signaling neutral-to-upward bias but suggesting the uptrend could be overextended.
- A break above 150.00 could target the 100-DMA at 150.98, while 149.00 provides key short-term support for bulls.

The US Dollar prints solid gains of more than 0.30% against the Japanese Yen after the pair dropped to a two-day low of 148.85, yet buyers bought the dip and push the exchange rate higher. Although US Treasury bond yields dropped, the USD/JPY trades at 149.71, above its opening price.
USD/JPY Price Forecast: Technical outlook
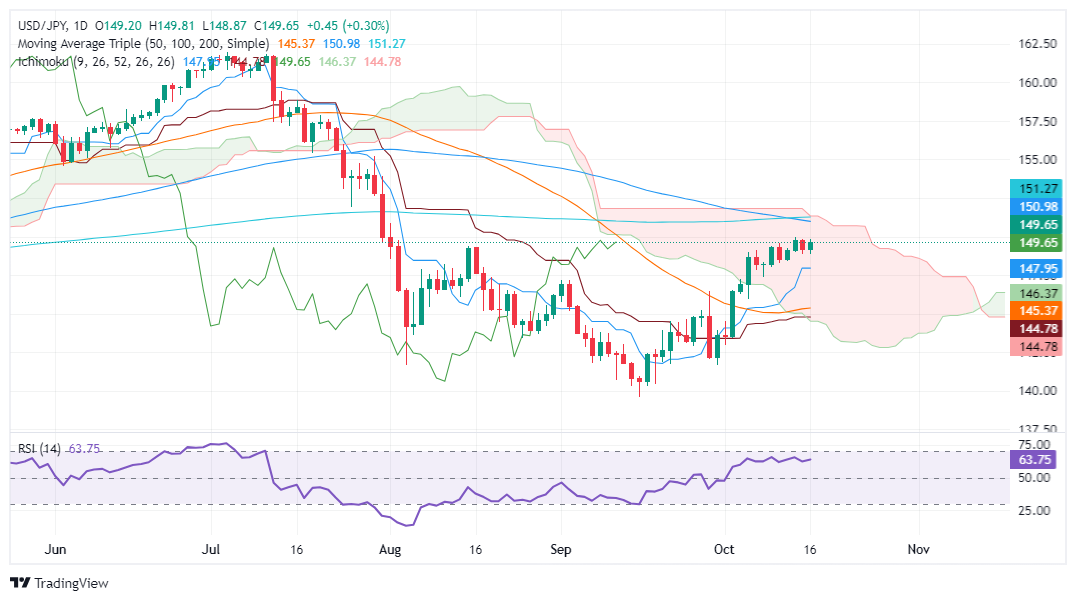
The daily chart suggests that USD/JPY is on a steady upward trajectory, though it maintains a neutral-to-upward bias. While technical signals indicate that buyers are in control, USD/JPY remains within the Ichimoku Cloud (Kumo), which is limiting its advance. Additionally, despite bullish conditions, the Relative Strength Index (RSI) has failed to surpass its last three peaks, indicating that the uptrend could be overextended.
If USD/JPY rises above 150.00, it could pave the way for a move towards the 100-day moving average (DMA) at 150.98, followed by the 200-DMA at 151.27.
Conversely, if USD/JPY drops below 149.00, the Tenkan-Sen at 147.95 will act as the first support for bulls. If breached, the next key support levels would be the Senkou Span A at 146.48, followed by the 50-DMA at 145.36.
USD/JPY Price Action – Daily Chart
Japanese Yen PRICE Today
The table below shows the percentage change of Japanese Yen (JPY) against listed major currencies today. Japanese Yen was the strongest against the British Pound.
| USD | EUR | GBP | JPY | CAD | AUD | NZD | CHF | |
|---|---|---|---|---|---|---|---|---|
| USD | 0.31% | 0.67% | 0.30% | -0.18% | 0.56% | 0.43% | 0.37% | |
| EUR | -0.31% | 0.37% | 0.02% | -0.46% | 0.26% | 0.14% | 0.02% | |
| GBP | -0.67% | -0.37% | -0.37% | -0.82% | -0.10% | -0.23% | -0.29% | |
| JPY | -0.30% | -0.02% | 0.37% | -0.45% | 0.26% | 0.16% | 0.10% | |
| CAD | 0.18% | 0.46% | 0.82% | 0.45% | 0.72% | 0.59% | 0.54% | |
| AUD | -0.56% | -0.26% | 0.10% | -0.26% | -0.72% | -0.13% | -0.18% | |
| NZD | -0.43% | -0.14% | 0.23% | -0.16% | -0.59% | 0.13% | -0.06% | |
| CHF | -0.37% | -0.02% | 0.29% | -0.10% | -0.54% | 0.18% | 0.06% |
The heat map shows percentage changes of major currencies against each other. The base currency is picked from the left column, while the quote currency is picked from the top row. For example, if you pick the Japanese Yen from the left column and move along the horizontal line to the US Dollar, the percentage change displayed in the box will represent JPY (base)/USD (quote).
Author

Christian Borjon Valencia
FXStreet
Markets analyst, news editor, and trading instructor with over 14 years of experience across FX, commodities, US equity indices, and global macro markets.


