- USD/JPY edges higher, trading within a range of 148.00-149.50 as US 10-year yields rise to 4.104%.
- Momentum favors buyers, with a break above 149.50, exposing the key 150.00 level and resistance at the 200/100-DMA confluence at 151.20/21.
- A drop below 149.00 could lead to a pullback toward the October 8 swing low of 147.35.
The USD/JPY edged higher during the North American session as US Treasury yields remained higher, particularly the 10-year T-note, which was up close to four basis points at 4.104%. The positive correlation between the US 10-year yield and the pair pushed the exchange rate to 149.13, up 0.37%.
USD/JPY Price Forecast: Technical outlook
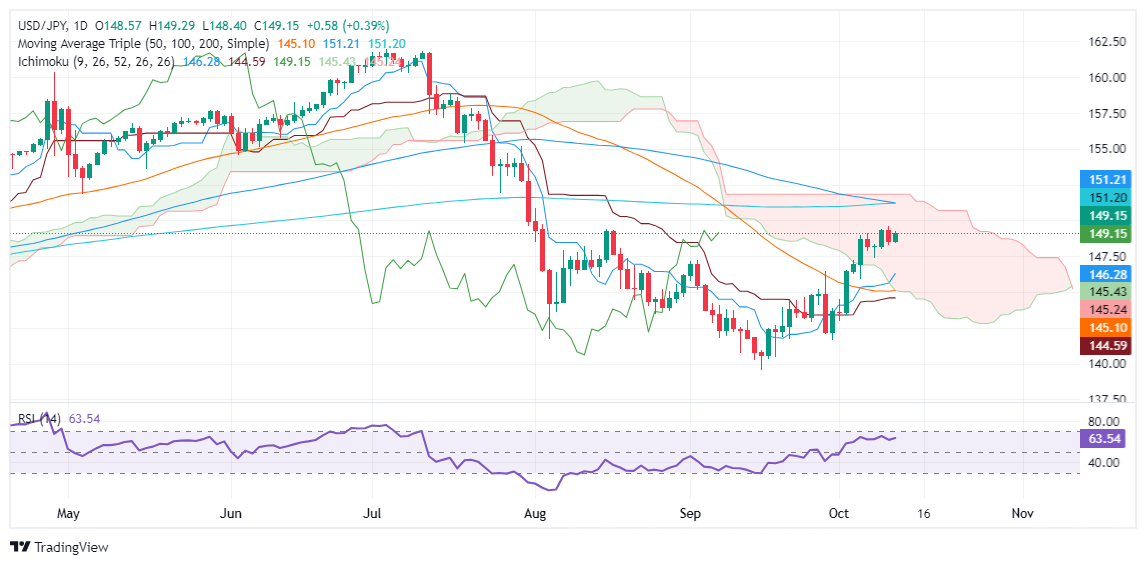
The USD/JPY is still neutrally biased, though trading in a higher range within the 148.00-149.50 area, as traders decipher the Fed and the Bank of Japan's next move.
From a momentum standpoint, buyers remain in charge, yet the Relative Strength Index (RSI) hasn’t reached a new peak to push USD/JPY prices higher.
If USD/JPY clears the 149.50 area, this will immediately expose the 150.00 figure. Once removed, the next resistance would be the 200 and 100-day moving averages (DMAs) confluence at 151.20/21.
Conversely, if the pair drops below 149.00, look for a pullback toward the October 8 swing low of 147.35.
USD/JPY Price Action – Daily Chart
Japanese Yen PRICE Today
The table below shows the percentage change of Japanese Yen (JPY) against listed major currencies today. Japanese Yen was the strongest against the Canadian Dollar.
USD | EUR | GBP | JPY | CAD | AUD | NZD | CHF | |
---|---|---|---|---|---|---|---|---|
USD | -0.05% | -0.07% | 0.39% | 0.17% | -0.20% | -0.28% | 0.12% | |
EUR | 0.05% | -0.05% | 0.38% | 0.17% | -0.16% | -0.28% | 0.10% | |
GBP | 0.07% | 0.05% | 0.45% | 0.24% | -0.10% | -0.21% | 0.19% | |
JPY | -0.39% | -0.38% | -0.45% | -0.24% | -0.56% | -0.67% | -0.36% | |
CAD | -0.17% | -0.17% | -0.24% | 0.24% | -0.34% | -0.43% | -0.03% | |
AUD | 0.20% | 0.16% | 0.10% | 0.56% | 0.34% | -0.13% | 0.27% | |
NZD | 0.28% | 0.28% | 0.21% | 0.67% | 0.43% | 0.13% | 0.41% | |
CHF | -0.12% | -0.10% | -0.19% | 0.36% | 0.03% | -0.27% | -0.41% |
The heat map shows percentage changes of major currencies against each other. The base currency is picked from the left column, while the quote currency is picked from the top row. For example, if you pick the Japanese Yen from the left column and move along the horizontal line to the US Dollar, the percentage change displayed in the box will represent JPY (base)/USD (quote).
Information on these pages contains forward-looking statements that involve risks and uncertainties. Markets and instruments profiled on this page are for informational purposes only and should not in any way come across as a recommendation to buy or sell in these assets. You should do your own thorough research before making any investment decisions. FXStreet does not in any way guarantee that this information is free from mistakes, errors, or material misstatements. It also does not guarantee that this information is of a timely nature. Investing in Open Markets involves a great deal of risk, including the loss of all or a portion of your investment, as well as emotional distress. All risks, losses and costs associated with investing, including total loss of principal, are your responsibility. The views and opinions expressed in this article are those of the authors and do not necessarily reflect the official policy or position of FXStreet nor its advertisers. The author will not be held responsible for information that is found at the end of links posted on this page.
If not otherwise explicitly mentioned in the body of the article, at the time of writing, the author has no position in any stock mentioned in this article and no business relationship with any company mentioned. The author has not received compensation for writing this article, other than from FXStreet.
FXStreet and the author do not provide personalized recommendations. The author makes no representations as to the accuracy, completeness, or suitability of this information. FXStreet and the author will not be liable for any errors, omissions or any losses, injuries or damages arising from this information and its display or use. Errors and omissions excepted.
The author and FXStreet are not registered investment advisors and nothing in this article is intended to be investment advice.
Recommended content
Editors’ Picks

Gold nears $3,400; fresh record highs and counting amid USD sell-off
Gold price closes in on $3,400 as the record rally regains strength on Easter Monday. Concerns over US-China trade war escalation and the Fed’s independence smash the US Dollar to three-year troughs. RSI stays overbought on the daily chart, with thin volumes likely to exaggerate moves in Gold price.

EUR/USD extends rally toward 1.1600 as US Dollar keeps falling
EUR/USD trades roughly 1.5% higher so far this Monday as the relentless US Dollar selling drives it toward the 1.1600 threshold - the highest level since November 2021. Growing concerns over a US economic recession and the Federal Reserve’s autonomy continue to exert downward pressure on the USD.

GBP/USD surges past 1.3400 on intense US Dollar weakness
GBP/USD continues its winning streak, recapturing 1.3400 in European trading on Monday. The extended US Dollar weakness, amid US-Sino trade war-led recession fears and heightened threat to the Fed's independence, continue to underpin the pair. Thin trading is set to extend.

How to make sense of crypto recovery – Is it a buy or fakeout
Bitcoin (BTC), Ethereum (ETH) and XRP, the top three cryptocurrencies by market capitalization, extend their last week’s recovery on Monday, even as trader sentiment is hurt by the US President Donald Trump’s tariff policy and announcements.

Five fundamentals for the week: Traders confront the trade war, important surveys, key Fed speech Premium
Will the US strike a trade deal with Japan? That would be positive progress. However, recent developments are not that positive, and there's only one certainty: headlines will dominate markets. Fresh US economic data is also of interest.

The Best brokers to trade EUR/USD
SPONSORED Discover the top brokers for trading EUR/USD in 2025. Our list features brokers with competitive spreads, fast execution, and powerful platforms. Whether you're a beginner or an expert, find the right partner to navigate the dynamic Forex market.