|

USD/JPY Price Analysis: US dollar extends losses vs. Japanese yen, trades near 108.00 figure

  • USD/JPY is easing from monthly tops while breaking below the 200 SMA on the four-hour chart. 
  • Support is seen in the 108.00/107.60 price zone.
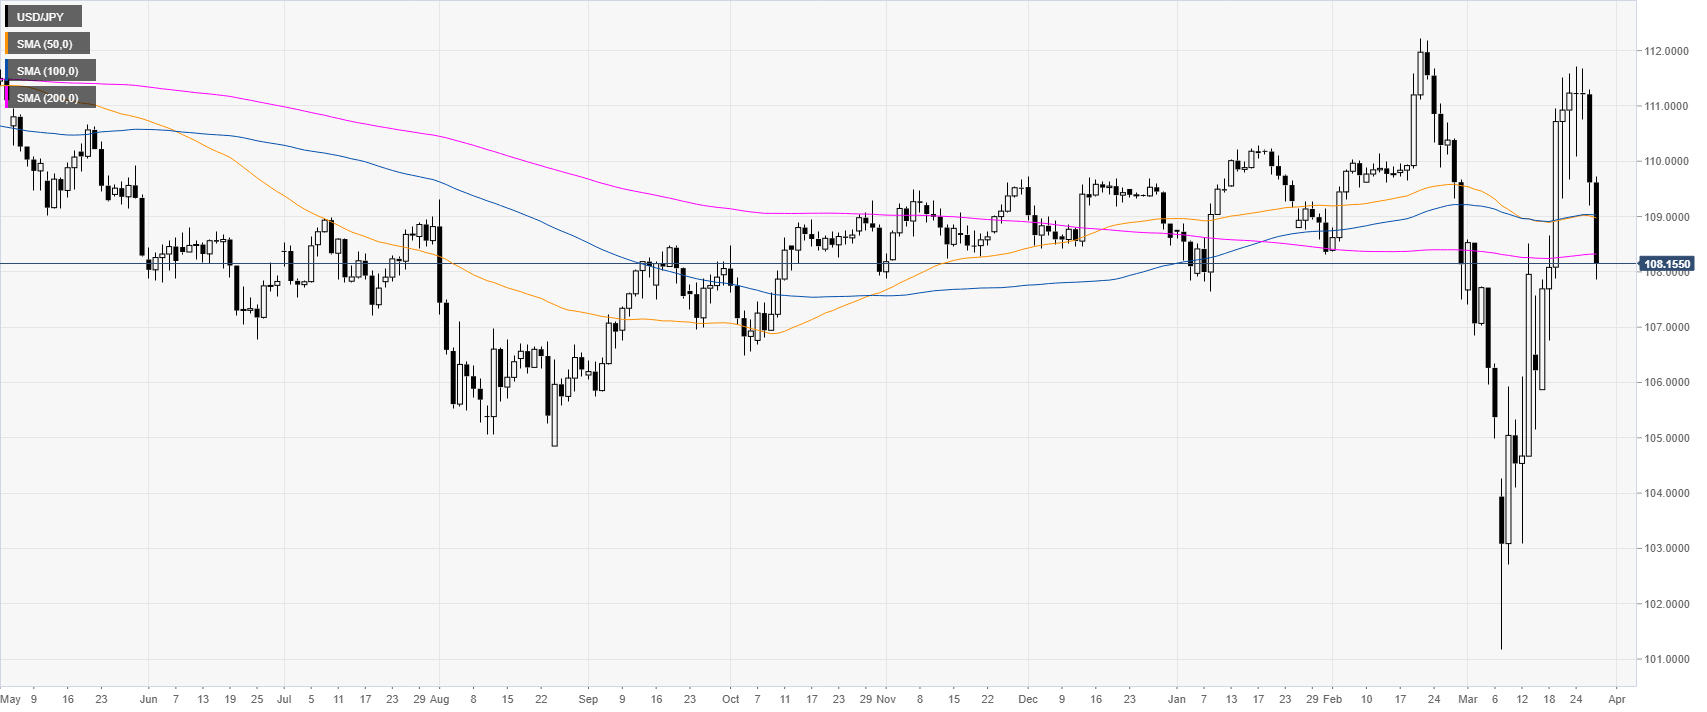
USD/JPY daily chart

USD/JPY is retreating down from monthly tops as the spot is challenging the 200 SMA on the daily chart. 

USD/JPY four-hour chart

USD/JPY declined to the 10.800 figure below the 50 and 200 SMAs. Bulls want to generate a bounce but a break above 109.24 would be needed as confirmation. On the other hand, sellers will take advantage of the negative momentum to break below the 108.00/107.60 support zone en route towards the 106.88 level, according to the Technical Confluences Indicator.  
 
 
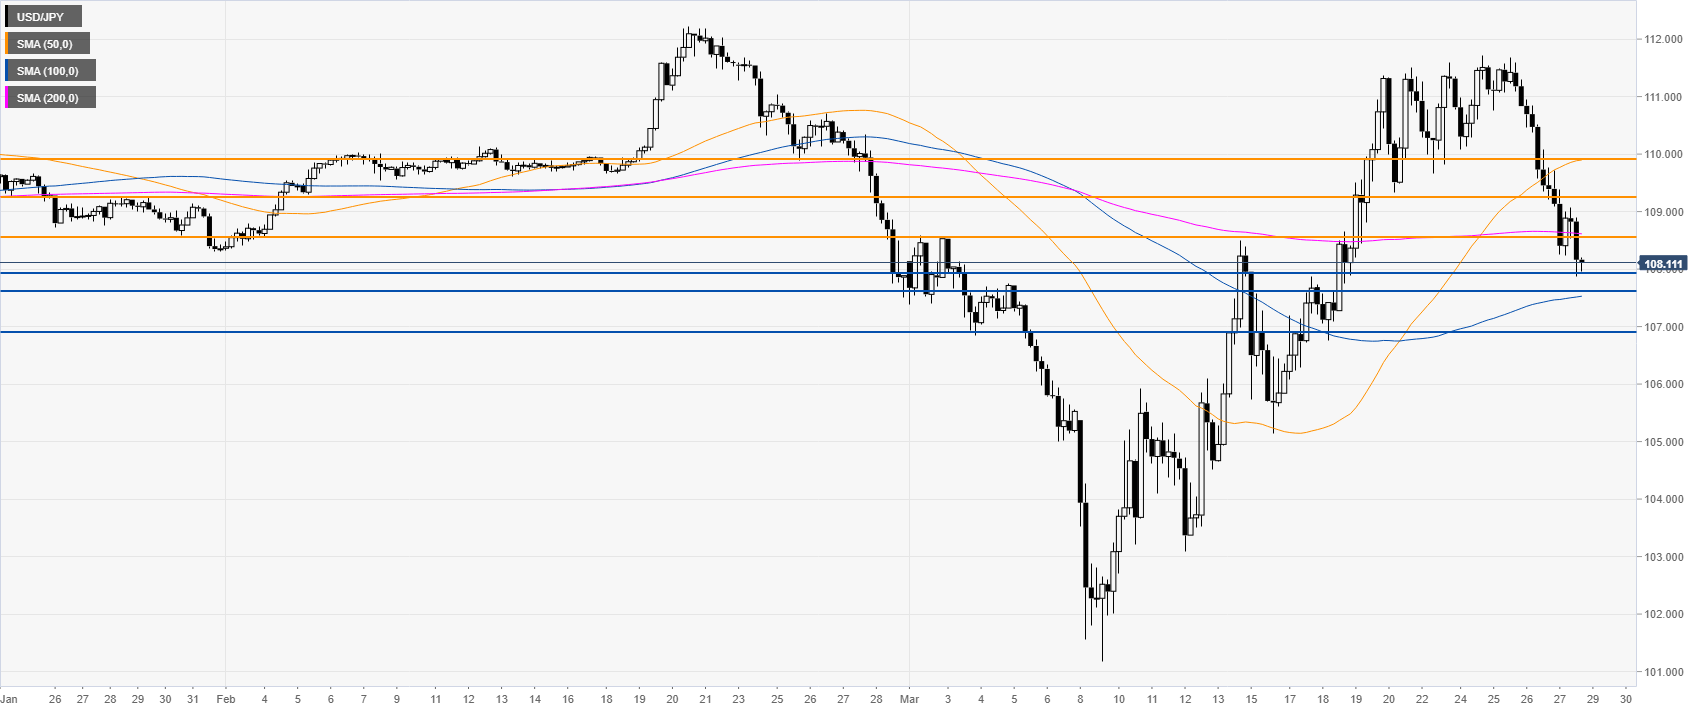
Resistance: 108.55, 109.24, 110.00
Support: 108.00, 107.60, 106.88

Additional key levels

USD/JPY

Overview
Today last price108.14
Today Daily Change-1.48
Today Daily Change %-1.35
Today daily open109.62
 
Trends
Daily SMA20107.71
Daily SMA50109
Daily SMA100109.04
Daily SMA200108.33
 
Levels
Previous Daily High111.3
Previous Daily Low109.21
Previous Weekly High111.51
Previous Weekly Low105.15
Previous Monthly High112.23
Previous Monthly Low107.51
Daily Fibonacci 38.2%110.01
Daily Fibonacci 61.8%110.5
Daily Pivot Point S1108.78
Daily Pivot Point S2107.95
Daily Pivot Point S3106.69
Daily Pivot Point R1110.87
Daily Pivot Point R2112.13
Daily Pivot Point R3112.97

Author

Flavio Tosti

Flavio Tosti

Independent Analyst


More from Flavio Tosti
Share:

Markets move fast. We move first.

Orange Juice Newsletter brings you expert driven insights - not headlines. Every day on your inbox.

By subscribing you agree to our Terms and conditions.

Editor's Picks

EUR/USD bounces toward 1.1750 as US Dollar loses strength

EUR/USD returned to the 1.1750 price zone in the American session on Friday, despite falling Wall Street, which indicates risk aversion. Trading conditions remain thin following the New Year holiday and ahead of the weekend, with the focus shifting to US employment and European data scheduled for next week.

GBP/USD nears 1.3500, holds within familiar levels

After testing 1.3400 on the last day of 2025, GBP/USD managed to stage a rebound. Nevertheless, the pair finds it difficult to gather momentum and trades with modest intraday gains at around 1.3490 as market participants remain in holiday mood.

Gold trims intraday gains, approaches $4,300

Gold retreated sharply from the $4,400  area and trades flat for the day in the $4,320 price zone. Choppy trading conditions exacerbated the intraday decline, although XAU/USD bearish case is out of the picture, considering growing expectations for a dovish Fed and persistent geopolitical tensions.

Cardano gains early New Year momentum, bulls target falling wedge breakout

Cardano kicks off the New Year on a positive note and is extending gains, trading above $0.36 at the time of writing on Friday. Improving on-chain and derivatives data point to growing bullish interest, while the technical outlook keeps an upside breakout in focus.

Economic outlook 2026-2027 in advanced countries: Solidity test

After a year marked by global economic resilience and ending on a note of optimism, 2026 looks promising and could be a year of solid economic performance. In our baseline scenario, we expect most of the supportive factors at work in 2025 to continue to play a role in 2026.

Crypto market outlook for 2026

Year 2025 was volatile, as crypto often is.  Among positive catalysts were favourable regulatory changes in the U.S., rise of Digital Asset Treasuries (DAT), adoption of AI and tokenization of Real-World-Assets (RWA).