|

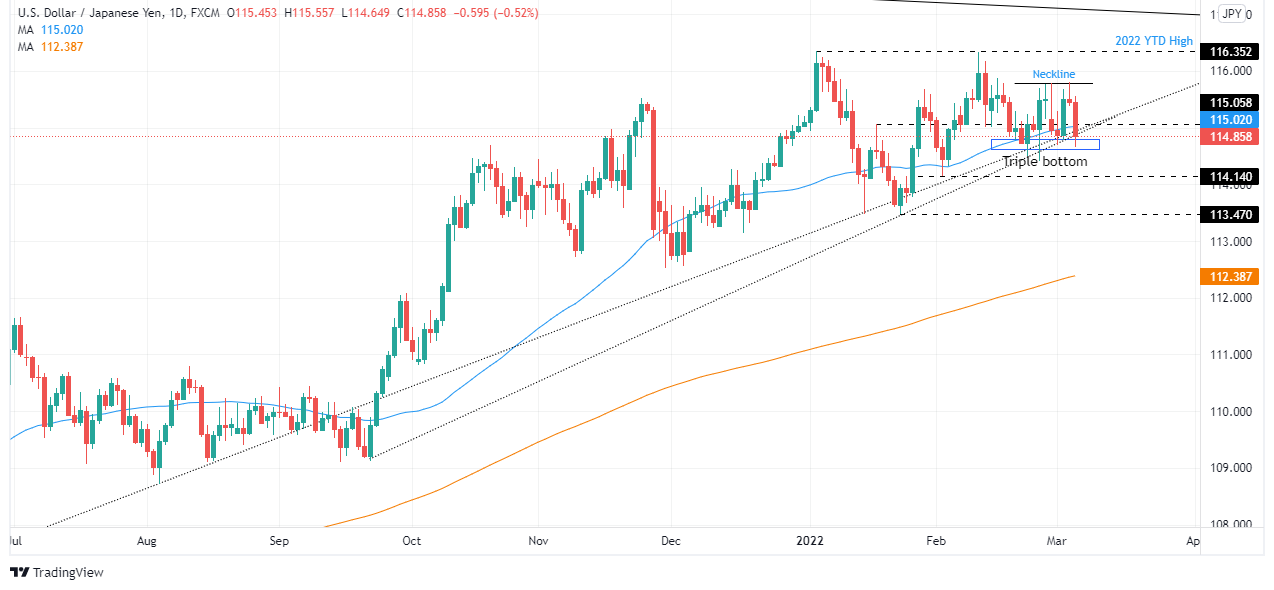
USD/JPY Price Analysis: Triple-bottom looms, targeting profits around 117.00

  • The USD/JPY is set to finish the week with losses, so far down 0.59%.
  • A dismal market mood weighed on US Treasury yields and the USD/JPY.
  • USD/JPY Technical Outlook: A triple-bottom formation targets 117.48.

On Friday, the USD/JPY retreats from the double-bottom “neckline” at around 115.80 to weekly lows, negating the chart pattern late in the New York session. At 114.85, the USD/JPY reflects the risk-off market mood due to increasing tensions on the Russia-Ukraine conflict.

Global equity indexes recorded losses on a busy day on Friday. The greenback would finish the week with gains, up 0.88%, sitting at 98.583. Meanwhile, US Treasury yields drop to 1.726%, a loss of eleven basis points, a headwind for the USD/JPY pair.

During the overnight session, for North American traders, the USD/JPY was seesawing around the 115.25-115-55 range, but as American traders got to their desks, it plummeted towards high 114.60s.

USD/JPY Price Forecast: Technical outlook

The USD/JPY is upward biased, as depicted by the daily moving averages (DMAs) residing below the spot price, except for the 50-DMA. USD/JPY failure to clear the neckline exerted downward pressure on the pair, but the trend stalled around previous lows that formed the double-bottom. That said, a triple-bottom chart pattern looms

The USD/JPY first resistance level would be the neckline around 115.78. Breach of the latter would expose 116.00, followed by the YTD high at 116.35, and the triple-bottoms target at 117.48.
USD/JPY

Overview
Today last price114.81
Today Daily Change-0.63
Today Daily Change %-0.55
Today daily open115.44
 
Trends
Daily SMA20115.3
Daily SMA50115.03
Daily SMA100114.45
Daily SMA200112.38
 
Levels
Previous Daily High115.81
Previous Daily Low115.38
Previous Weekly High115.76
Previous Weekly Low114.41
Previous Monthly High116.34
Previous Monthly Low114.16
Daily Fibonacci 38.2%115.55
Daily Fibonacci 61.8%115.65
Daily Pivot Point S1115.28
Daily Pivot Point S2115.12
Daily Pivot Point S3114.86
Daily Pivot Point R1115.7
Daily Pivot Point R2115.97
Daily Pivot Point R3116.13

Author

Christian Borjon Valencia

Markets analyst, news editor, and trading instructor with over 14 years of experience across FX, commodities, US equity indices, and global macro markets.


More from Christian Borjon Valencia
Share:

Editor's Picks

GBP/USD clings to 1.3500 amid marginal losses

GBP/USD alternates gains with losses around the 1.3500 neighbourhood on Tuesday. Indeed, Cable struggles to further extend its incipient recovery in a context of continuous instability in the Middle East and modest gains in the Greenback.

EUR/USD alternates gains with losses near 1.1540

EUR/USD navigates a tight range near 1.1550 in the latter part of Tuesday’s NA session. The US Dollar’s vacillating price action accompanies the pair while market participants gear up for the crucial US inflation data due on Wednesday.

Gold loses the grip below $4,400

Gold retreats from its earlier tops and briefly revisited the $4,350 region per troy ounce on Tuesday. The yellow metal’s modest retracement follows lacklustre gains in the US Dollar and declining US Treasury yields across the curve, all amid steady uncertainty from the geopolitical landscape.

Shiba Inu Price Forecast: SHIB extends sell-off despite surging futures Open Interest
Shiba Inu (SHIB) maintains a bearish outlook on Tuesday, as it edges lower at $0.00000450. This marks the seventh day the meme coin has sustained a sell-off, weighed down by a weak technical structure. Shiba Inu derivatives continue to gain momentum, with perpetual futures Open Interest (OI) rising to 11.08 trillion SHIB on Tuesday, from 10.46 trillion the day before.
The inflation narrative is still way more important than the employment story
Core bonds sold off yesterday with the belly of the curve slightly underperforming in the US while European curves showed more of a bear flattening. Daily changes on the US curve varied between +4.7 bps (2-yr) and +6.4 bps (7-yr).
9-3: Is the Federal Reserve’s vote tally Warsh's new forward guidance?
The rate did not move. Neither did the statement, and that’s the more interesting fact. Set the July 29 Federal Open Market Committee (FOMC) statement beside the one issued on June 17, and the two documents are identical apart from a single verb and a paragraph at the bottom naming three dissenters.