USD/JPY Price Analysis: Trades with modest losses below 140.00, bullish potential intact


  • USD/JPY edges lower on Thursday and reverses a part of the overnight positive move.
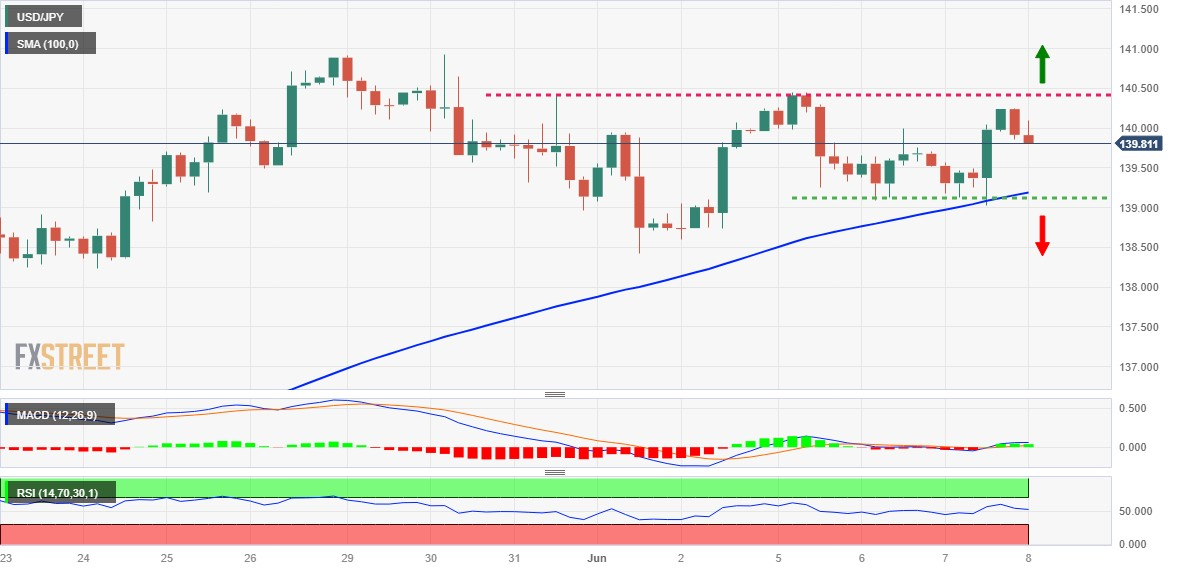
  • The recent range-bound price action constitutes the formation of a bullish rectangle.
  • A convincing break below 139.00 is needed to support prospects for additional losses.

The USD/JPY pair struggles to capitalize on the overnight goodish rebound from the 139.00 mark, or the weekly low and meets with some supply during the Asian session on Thursday. Spot prices currently trade around the 139.85 area, down nearly 0.20% for the day, though any meaningful downside still seems elusive.

Speculations for more sizeable interventions by the Bank of Japan (BoJ) to support the domestic currency, along with the cautious market mood, benefit the safe-haven Japanese Yen (JPY). Apart from this, a modest US Dollar (USD) downtick exerts some downward pressure on the USD/JPY pair. That said, the uncertainty over the Federal Reserve's (Fed) rate-hike path and elevated US Treasury bond yields should help limit the downside for the buck, which, in turn, should lend support to the major.

From a technical perspective, the USD/JPY pair has been oscillating in a range since the beginning of the current week, forming a rectangle on hourly charts. Against the backdrop of a rally from the mid-133.00s, or the May monthly swing low, this might still be categorized as a bullish consolidation phase. Moreover, spot prices, so far, manage to hold above the upward-sloping 100-period Simple Moving Average (SMA) on the 4-hour chart, which favours bulls and supports prospects for further gains.

Bullish traders, however, need to wait for acceptance above the 140.00 psychological mark and a sustained break through the 140.20-140.30 horizontal resistance before placing fresh bets. The USD/JPY pair might then accelerate the positive move towards challenging the YTD peak, around the 140.90 region, touched in May. Some follow-through buying beyond the 141.00 mark will be seen as a fresh trigger for bullish traders and set the stage for a further appreciating move for the pair.

On the flip side, the 100-period SMA, currently pegged just ahead of the 139.00 round figure, might continue to protect the immediate downside. A convincing break below the 139.00 mark might prompt some technical selling and drag the USD/JPY pair to the monthly low, around the 138.45-138.40 zone. The downward trajectory could get extended further towards the 138.00 mark before spot prices eventually drop to the 137.30 region, representing the very important 200-day SMA support.

USD/JPY 4-hour chart

fxsoriginal

Key levels to watch

USD/JPY

Overview
Today last price 139.88
Today Daily Change -0.22
Today Daily Change % -0.16
Today daily open 140.1
 
Trends
Daily SMA20 138.6
Daily SMA50 135.8
Daily SMA100 134.3
Daily SMA200 137.31
 
Levels
Previous Daily High 140.25
Previous Daily Low 139.02
Previous Weekly High 140.93
Previous Weekly Low 138.43
Previous Monthly High 140.93
Previous Monthly Low 133.5
Daily Fibonacci 38.2% 139.78
Daily Fibonacci 61.8% 139.49
Daily Pivot Point S1 139.34
Daily Pivot Point S2 138.57
Daily Pivot Point S3 138.12
Daily Pivot Point R1 140.56
Daily Pivot Point R2 141.01
Daily Pivot Point R3 141.78


Share: Feed news

Information on these pages contains forward-looking statements that involve risks and uncertainties. Markets and instruments profiled on this page are for informational purposes only and should not in any way come across as a recommendation to buy or sell in these assets. You should do your own thorough research before making any investment decisions. FXStreet does not in any way guarantee that this information is free from mistakes, errors, or material misstatements. It also does not guarantee that this information is of a timely nature. Investing in Open Markets involves a great deal of risk, including the loss of all or a portion of your investment, as well as emotional distress. All risks, losses and costs associated with investing, including total loss of principal, are your responsibility. The views and opinions expressed in this article are those of the authors and do not necessarily reflect the official policy or position of FXStreet nor its advertisers. The author will not be held responsible for information that is found at the end of links posted on this page.

If not otherwise explicitly mentioned in the body of the article, at the time of writing, the author has no position in any stock mentioned in this article and no business relationship with any company mentioned. The author has not received compensation for writing this article, other than from FXStreet.

FXStreet and the author do not provide personalized recommendations. The author makes no representations as to the accuracy, completeness, or suitability of this information. FXStreet and the author will not be liable for any errors, omissions or any losses, injuries or damages arising from this information and its display or use. Errors and omissions excepted.

The author and FXStreet are not registered investment advisors and nothing in this article is intended to be investment advice.

Recommended content


Recommended content

Editors’ Picks

EUR/USD clings to daily gains above 1.0650

EUR/USD clings to daily gains above 1.0650

EUR/USD gained traction and turned positive on the day above 1.0650. The improvement seen in risk mood following the earlier flight to safety weighs on the US Dollar ahead of the weekend and helps the pair push higher.

EUR/USD News

GBP/USD recovers toward 1.2450 after UK Retail Sales data

GBP/USD recovers toward 1.2450 after UK Retail Sales data

GBP/USD reversed its direction and advanced to the 1.2450 area after touching a fresh multi-month low below 1.2400 in the Asian session. The positive shift seen in risk mood on easing fears over a deepening Iran-Israel conflict supports the pair.

GBP/USD News

Gold holds steady at around $2,380 following earlier spike

Gold holds steady at around $2,380 following earlier spike

Gold stabilized near $2,380 after spiking above $2,400 with the immediate reaction to reports of Israel striking Iran. Meanwhile, the pullback seen in the US Treasury bond yields helps XAU/USD hold its ground.

Gold News

Bitcoin Weekly Forecast: BTC post-halving rally could be partially priced in Premium

Bitcoin Weekly Forecast: BTC post-halving rally could be partially priced in

Bitcoin price shows no signs of directional bias while it holds above  $60,000. The fourth BTC halving is partially priced in, according to Deutsche Bank’s research. 

Read more

Week ahead – US GDP and BoJ decision on top of next week’s agenda

Week ahead – US GDP and BoJ decision on top of next week’s agenda

US GDP, core PCE and PMIs the next tests for the Dollar. Investors await BoJ for guidance about next rate hike. EU and UK PMIs, as well as Australian CPIs also on tap.

Read more

Forex MAJORS

Cryptocurrencies

Signatures