• The USD/JPY daily chart is bearish biased, though it remains unable to extend its losses beneath 128.00
  • The USD/JPY is trading sideways in the near term, awaiting a break above/below 129.00/128.00.

On Thursday, the USD/JPY fails to hold to its gains and trades beneath its opening price by 0.33% after hitting a daily high of 128.88. At the time of writing, the USD/JPY exchanges hand at 128.40, amidst a risk-off impulse and a soft US Dollar (USD).

USD/JPY Price Analysis: Technical outlook

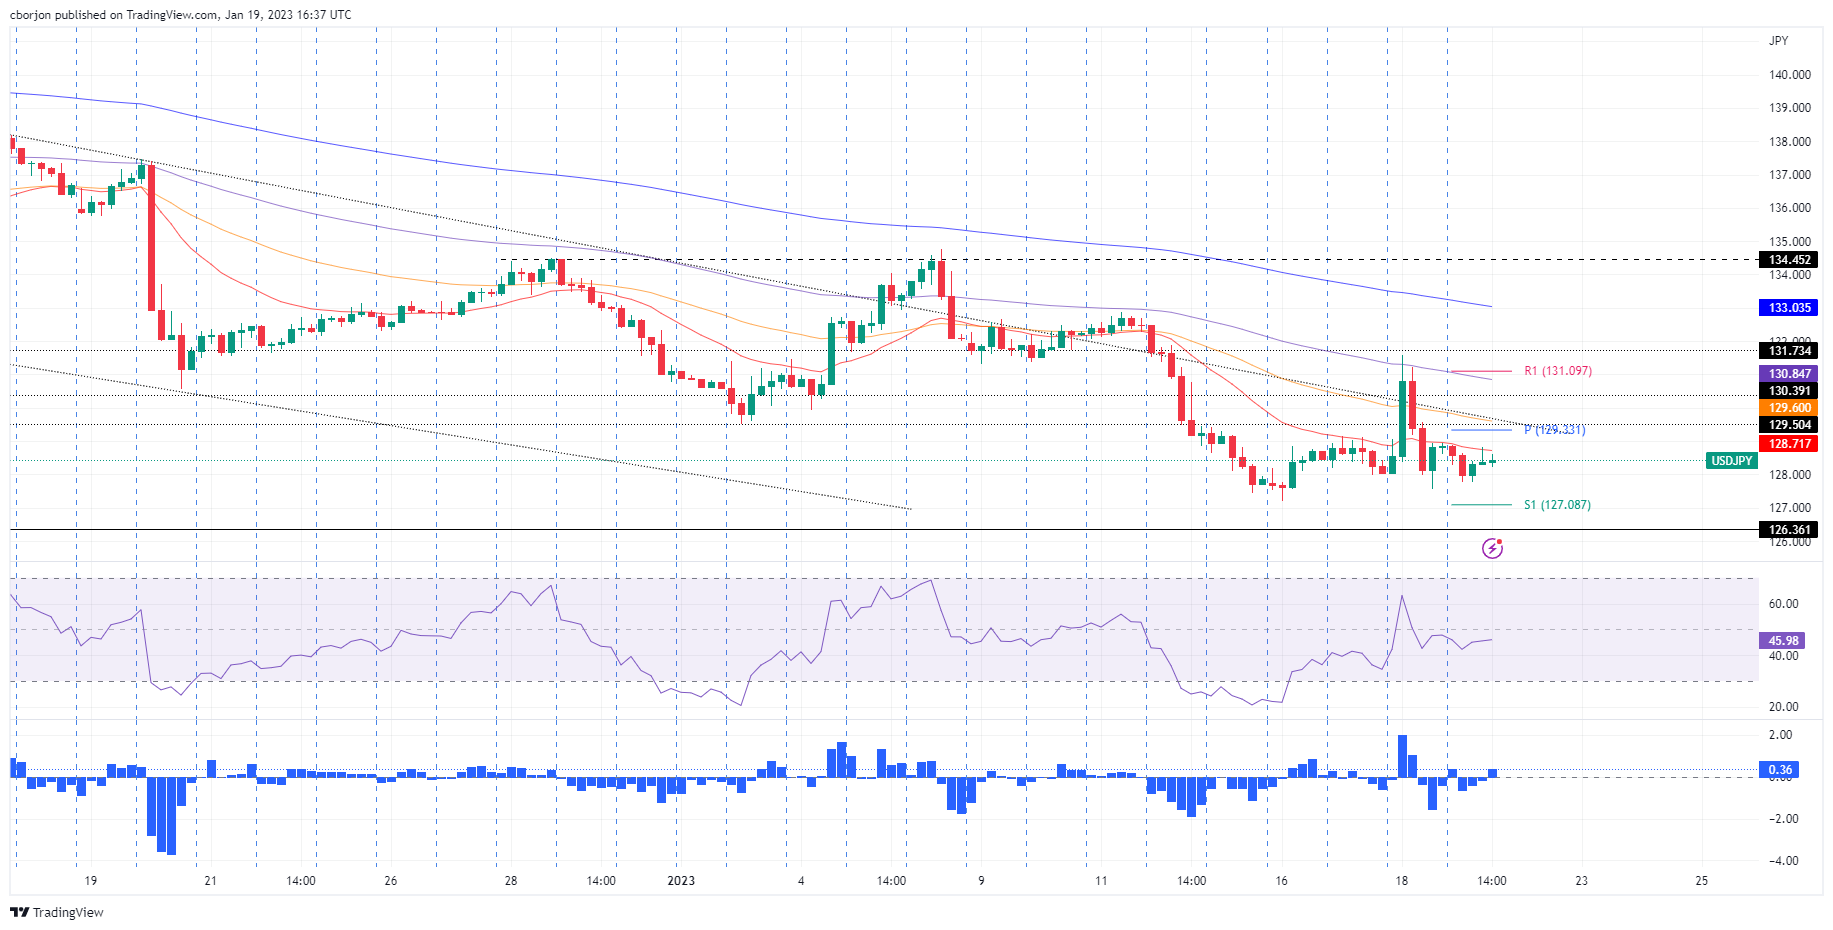
Failure to crack the 20-day Exponential Moving Average (EMA) at 131.13 exposed the USD/JPY to selling pressure. In addition, price action dived back below a three-month-old downslope resistance trendline, which tracks the USD/JPY downtrend. Therefore, the path of least resistance is downwards, but a decisive break below the YTD low of 127.21 is needed, so the USD/JPY might get poised towards the May 24 daily low of 126.36.

Short term, the USD/JPY 4-hour chart suggests the pair as range bound, although the Relative Strength Index (RSI) is at bearish territory. The Rate of Change (RoC) shows buyers gathering momentum. Hence, mixed signals surrounding the USD/JPY pair might refrain traders from opening fresh positions unless a decisive break is achieved.

The USD/JPY key resistance levels are 129.00, the daily pivot at 129.33, and the 50-EMA at 129.60. On the other hand, the USD/JPY first support would be 128.00, followed by the January 18 daily low of 127.55, ahead of 127.00.

USD/JPY Key Technical Levels

USD/JPY

Overview
Today last price 128.49
Today Daily Change -0.38
Today Daily Change % -0.29
Today daily open 128.87
 
Trends
Daily SMA20 131.48
Daily SMA50 135.24
Daily SMA100 140.32
Daily SMA200 136.68
 
Levels
Previous Daily High 131.58
Previous Daily Low 127.57
Previous Weekly High 132.87
Previous Weekly Low 127.46
Previous Monthly High 138.18
Previous Monthly Low 130.57
Daily Fibonacci 38.2% 130.05
Daily Fibonacci 61.8% 129.1
Daily Pivot Point S1 127.1
Daily Pivot Point S2 125.33
Daily Pivot Point S3 123.08
Daily Pivot Point R1 131.11
Daily Pivot Point R2 133.35
Daily Pivot Point R3 135.12


Share: Feed news

Information on these pages contains forward-looking statements that involve risks and uncertainties. Markets and instruments profiled on this page are for informational purposes only and should not in any way come across as a recommendation to buy or sell in these assets. You should do your own thorough research before making any investment decisions. FXStreet does not in any way guarantee that this information is free from mistakes, errors, or material misstatements. It also does not guarantee that this information is of a timely nature. Investing in Open Markets involves a great deal of risk, including the loss of all or a portion of your investment, as well as emotional distress. All risks, losses and costs associated with investing, including total loss of principal, are your responsibility. The views and opinions expressed in this article are those of the authors and do not necessarily reflect the official policy or position of FXStreet nor its advertisers. The author will not be held responsible for information that is found at the end of links posted on this page.

If not otherwise explicitly mentioned in the body of the article, at the time of writing, the author has no position in any stock mentioned in this article and no business relationship with any company mentioned. The author has not received compensation for writing this article, other than from FXStreet.

FXStreet and the author do not provide personalized recommendations. The author makes no representations as to the accuracy, completeness, or suitability of this information. FXStreet and the author will not be liable for any errors, omissions or any losses, injuries or damages arising from this information and its display or use. Errors and omissions excepted.

The author and FXStreet are not registered investment advisors and nothing in this article is intended to be investment advice.

Recommended content


Recommended content

Editors’ Picks

EUR/USD comes under pressure near 1.0630

EUR/USD comes under pressure near 1.0630

Further gains in the Greenback encourage sellers to maintain their control over the risk complex, forcing EUR/USD to retreat further and revisit the 1.0630 region as the US session draws to a close.

EUR/USD News

GBP/USD retreats toward 1.2450 on modest USD rebound

GBP/USD retreats toward 1.2450 on modest USD rebound

GBP/USD edges lower in the second half of the day and trades at around 1.2450. Better-than-expected Jobless Claims and Philadelphia Fed Manufacturing Index data from the US provides a support to the USD and forces the pair to stay on the back foot.

GBP/USD News

Gold is closely monitoring geopolitics

Gold is closely monitoring geopolitics

Gold trades in positive territory above $2,380 on Thursday. Although the benchmark 10-year US Treasury bond yield holds steady following upbeat US data, XAU/USD continues to stretch higher on growing fears over a deepening conflict in the Middle East.

Gold News

Ripple faces significant correction as former SEC litigator says lawsuit could make it to Supreme Court

Ripple faces significant correction as former SEC litigator says lawsuit could make it to Supreme Court

Ripple (XRP) price hovers below the key $0.50 level on Thursday after failing at another attempt to break and close above the resistance for the fourth day in a row. 

Read more

Have we seen the extent of the Fed rate repricing?

Have we seen the extent of the Fed rate repricing?

Markets have been mostly consolidating recent moves into Thursday. We’ve seen some profit taking on Dollar longs and renewed demand for US equities into the dip. Whether or not this holds up is a completely different story.

Read more

Forex MAJORS

Cryptocurrencies

Signatures