|

USD/JPY Price Analysis: Subdued around 133.50s after struggling at 134.00

  • USD/JPY is almost flat during the North American session.
  • Oscillators remain in bearish territory, but price action signals consolidation.
  • USD/JPY Price Analysis: Sellers reclaiming 132.21 would exacerbate a fall toward 127.20s.

USD/JPY rises after dropping to a fresh four-week low at 131.71 but stages a comeback and has reclaimed the 133.00 figure. Nevertheless, a wall of resistance with all the daily Exponential Moving Averages (EMAs) above the exchange rate supports a bearish bias. Hence, the USD/JPY is trading at 133.56, above its opening price by a decent 0.14%.

USD/JPY Price action

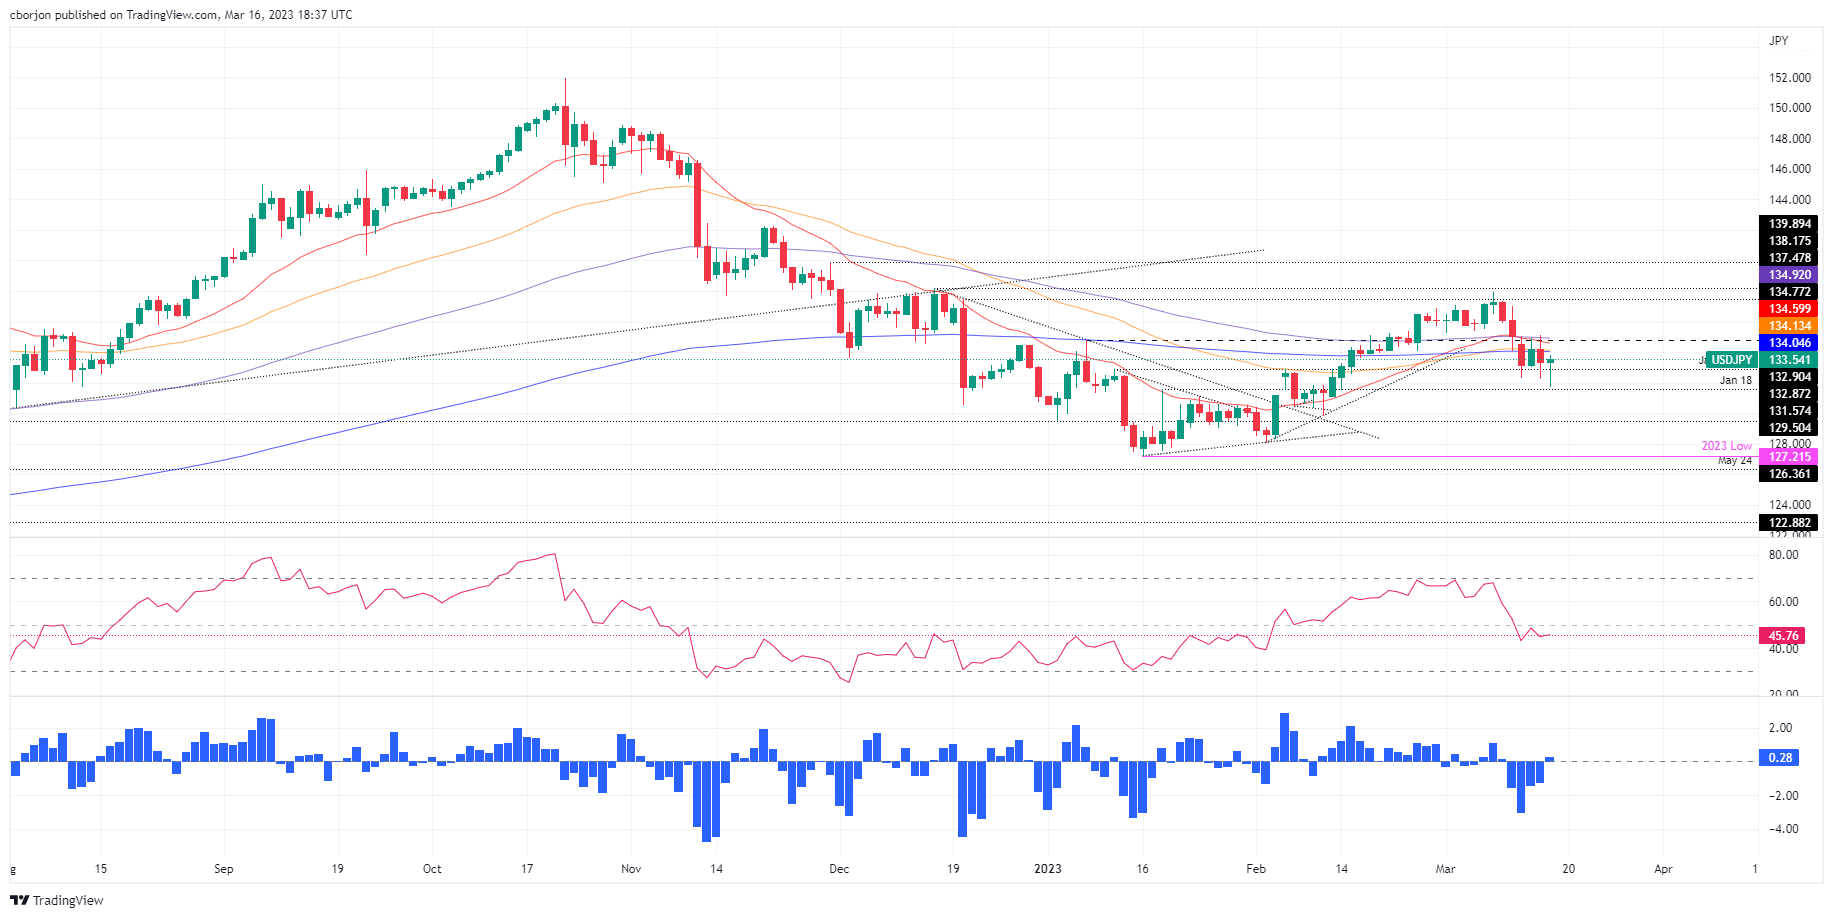
The USD/JPY is neutral biased after the 20, 50, 100, and 200-day EMAs intersected at around the 134.05-92 area. However, oscillators like the Relative Strength Index (RSI) and the Rate of Change (RoC), suggest that sellers are in charge. But price action, as the leading indicator, needs sellers to reclaim the February 10 daily low at 129.79, which could open the door for further downside.

For a bearish continuation, the USD/JPY must fall below the March 15 low of 132.21. Once cleared, the 132.00 figure would be for grabs. Seller's next stop would be the February 2 daily low at 128.08, followed by the YTD low at 127.21.

In an alternate scenario, the USD/JPY first resistance would be the 200-day EMA at 134.05. A breach of the latter would expose the 50 and 20-day EMAs, each at 134.13 and 134.59, ahead of testing the 100-day EMA at 134.92. Once broken, the buyers would reclaim 135.00.

USD/JPY Daily chart

USD/JPY Technical levels

USD/JPY

Overview
Today last price133.6
Today Daily Change0.18
Today Daily Change %0.13
Today daily open133.42
 
Trends
Daily SMA20135.33
Daily SMA50132.54
Daily SMA100135.56
Daily SMA200137.49
 
Levels
Previous Daily High135.12
Previous Daily Low132.22
Previous Weekly High137.91
Previous Weekly Low134.12
Previous Monthly High136.92
Previous Monthly Low128.08
Daily Fibonacci 38.2%133.32
Daily Fibonacci 61.8%134.01
Daily Pivot Point S1132.05
Daily Pivot Point S2130.68
Daily Pivot Point S3129.15
Daily Pivot Point R1134.95
Daily Pivot Point R2136.48
Daily Pivot Point R3137.85

Author

Christian Borjon Valencia

Markets analyst, news editor, and trading instructor with over 14 years of experience across FX, commodities, US equity indices, and global macro markets.

More from Christian Borjon Valencia
Share:

Editor's Picks

EUR/USD struggles aroound 1.1800 as USD stabilizes

EUR/USD stays defensive around 1.1800 in the European session on Thursday. The US Dollar stabilizes, following the recent decline led by tariff uncertainty, capping the pair's upside. All eyes now remain on the US-Iran nuclear talks after ECB President Lagarde's testimony fails to impress Euro bulls. 

GBP/USD drops toward 1.3500 as USD finds fresh demand

GBP/USD falls back toward 1.3500 in the European session on Thursday, snapping its recovery momentum. The pair loses traction as the US Dollar finds fresh demand, as markets turn cautious ahead of the US-Iran nuclear talks. The US trade policy uncertainty also remains a drag on risk sentiment. 

Gold clings to gains amid sustained safe-haven flows ahead of US-Iran talks

Gold sticks to its modest intraday gains through the first half of the European session on Thursday, with bulls still awaiting a sustained move and acceptance above the $5,200 mark before placing fresh bets. 

Stellar: Relief bounce fades as bearish undertone persists

Stellar is trading around $0.16 at the time of writing on Thursday after rebounding more than 8% in the previous day. Derivatives data paints a negative picture as XLM’s short bets hit a monthly high while Open Interest continues to decline.

The one thing everyone is on the lookout for is US action of some sort against Iran

The FX market is minestrone soup these days. It is befuddled by conflicting data, rumors and small stories exaggerated out of proportion, and Trump-generated uncertainty. 

Solana strikes key resistance with double-digit gains

Solana trades at $88 at press time on Thursday, after an 11% upswing the previous day within a broader consolidation range of roughly three weeks. Institutional demand for Solana heightens as US spot SOL Exchange Traded Funds record $30 million of inflow on Wednesday.