|

USD/JPY Price Analysis: Struggles at weekly highs, retraces back to 134.10s

  • USD/JPY hit a weekly high of 134.46 but retraced toward the 134.10 area.
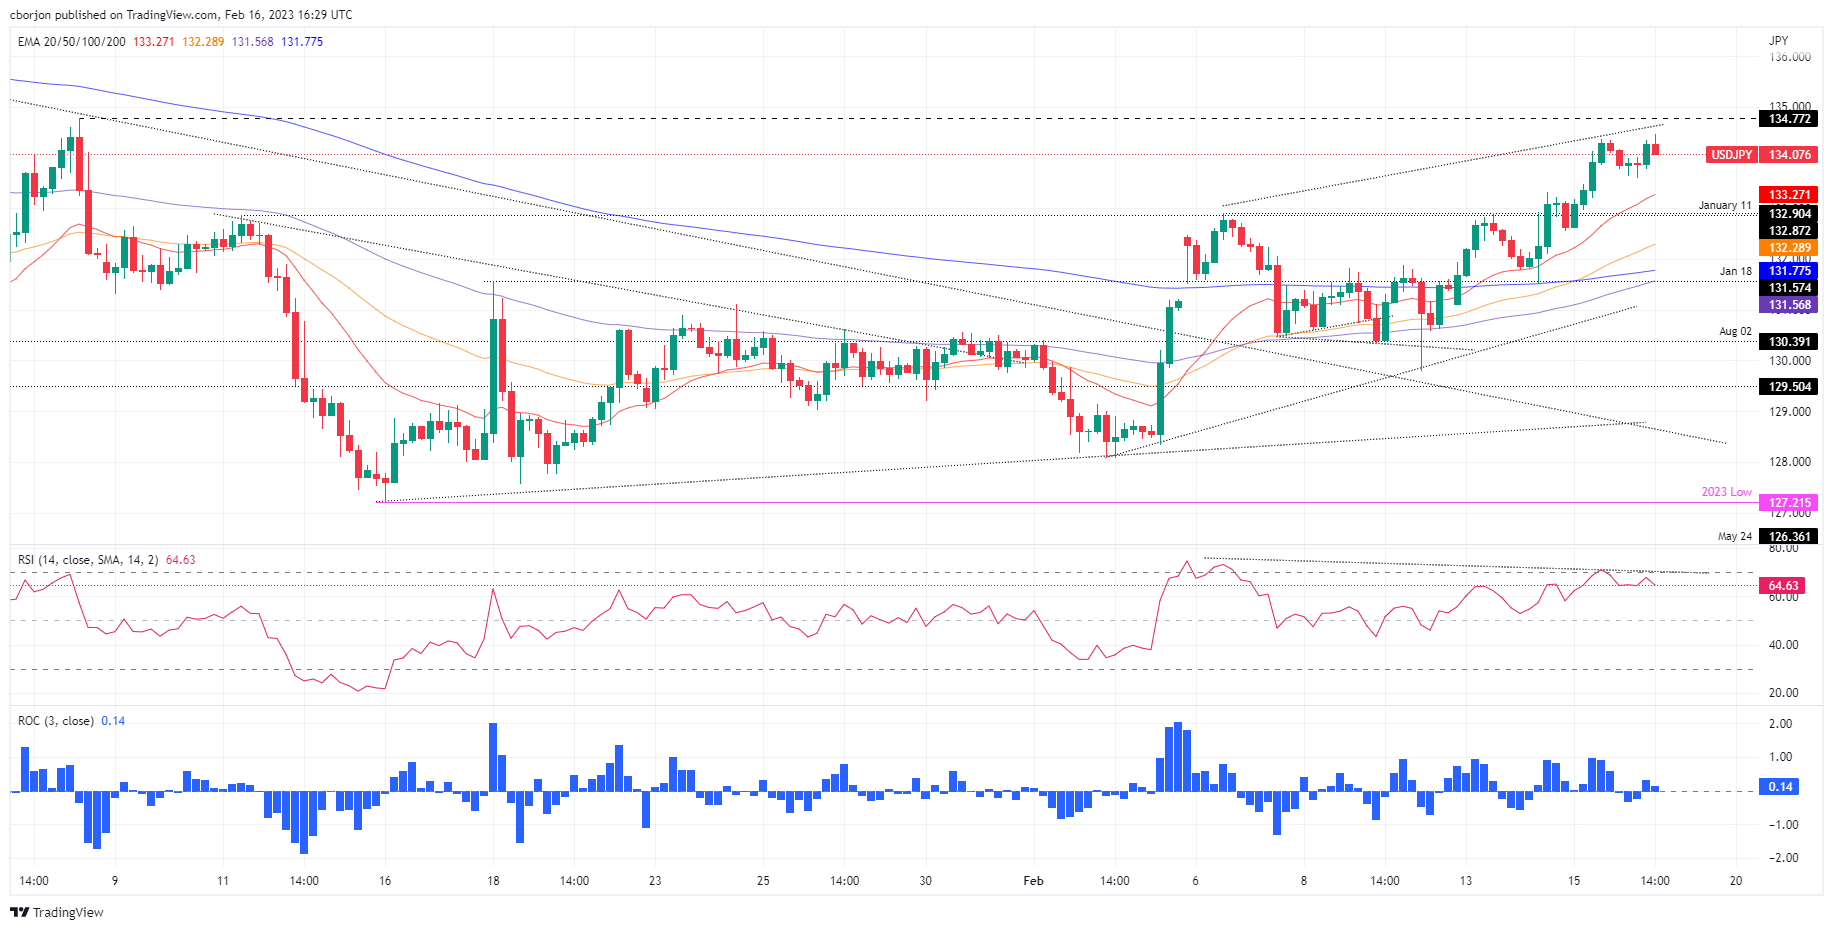
  • USD/JPY Price Analysis: Negative divergence between oscillators and price action could pave the way for downside action.

The USD/JPY consolidated around the 134.00 area after hitting a daily high of 134.46, though bears stepped in around the highs of the week, dragging prices lower. Hence, the USD/JPY changed its course gears and records minimal losses of 0.08%. The USD/JPY pair is trading around 134.10s on Thursday.

On February 15, the USD/JPY reached a daily high at 134.35, and since then, the USD/JPY has remained sideways within the 133.60/134.30 area. Even though the Relative Strength Index  (RSI) is in bullish territory, as USD/JPY price action has headed north, the RSI did not. Hence, a negative divergence could emerge, suggesting that a price reversal looms.

If that scenario plays out, the USD/JPY first support would be this week’s low at 133.60. Break below, and the 20-day Exponential Moving Average (EMA) would be exposed at 133.28, followed by the February 13 daily high-turned support at 132.90.

On an alternate scenario, the USD/JPY’s first resistance would be the day’s high at 134.46, which, once cleared, could lift the USD/JPY to January 6 high at 134.77 before the major climbs to 135.00.

USD/JPY Daily chart

USD/JPY Key technical levels

USD/JPY

Overview
Today last price134.18
Today Daily Change0.07
Today Daily Change %0.05
Today daily open134.11
 
Trends
Daily SMA20130.78
Daily SMA50132.05
Daily SMA100137.86
Daily SMA200136.87
 
Levels
Previous Daily High134.36
Previous Daily Low132.55
Previous Weekly High132.91
Previous Weekly Low129.81
Previous Monthly High134.78
Previous Monthly Low127.22
Daily Fibonacci 38.2%133.67
Daily Fibonacci 61.8%133.24
Daily Pivot Point S1132.99
Daily Pivot Point S2131.86
Daily Pivot Point S3131.17
Daily Pivot Point R1134.8
Daily Pivot Point R2135.48
Daily Pivot Point R3136.61

Author

Christian Borjon Valencia

Markets analyst, news editor, and trading instructor with over 14 years of experience across FX, commodities, US equity indices, and global macro markets.

More from Christian Borjon Valencia
Share:

Editor's Picks

GBP/USD bounces off lows, back above 1.3200

After bottoming out near 1.3160, GBP/USD manages to regain a bit of shine and reclaim the 1.3200 mark and beyond at the end of the week. Stronger-than-expected UK Retail Sales data seem to be helping the British Pound limit its losses, while the chaotic UK political environment keeps the bulls at bay for now.

EUR/USD looks consolidative around 1.1460

EUR/USD stages a modest rebound after slipping to a three-month low below 1.1420 at the end of the week. That said, the pair now looks to consolidate humble gains just above 1.1460 despite growing uncertainty surrounding the next round of US-Iran negotiations, which keeps the US Dollar’s downside contained.

Gold slips back to six-day lows, targets $4,100

Gold retreats for the third consecutive day on Friday, eroding gains seen in the first half of the week and approaching the key $4,100 mark per troy ounce. Indeed, the precious metal continues to face headwinds from the Fed's hawkish stance and renewed uncertainty surrounding the next round of US-Iran negotiations.

Solana extends correction despite ETF inflows, RWA adoption

Solana (SOL) price edges below $70 extending its losses for the fourth straight day this week. The institutional demand for Solana is building, with steady inflows so far this week and Morgan Stanley’s amended S-1 filing for a Solana-focused Exchange-Traded Fund.

The Iran war didn't break the US economy, but what happens next?

Nearly four months after the start of the Iran war, the US economy remains remarkably resilient. While the conflict initially triggered a severe disruption to global energy markets and a sharp rise in Oil prices, recent diplomatic progress between Washington and Tehran has eased concerns about a prolonged supply shock.

Regime change: Inside Kevin Warsh's first move to make the Fed unreadable on purpose

The rate did not move. That was the least interesting thing about Kevin Warsh's first meeting in charge of the Fed. The FOMC held its benchmark at 3.50%-3.75% for the fourth straight meeting, exactly as priced, and then the new chair used his first press conference to dismantle the machinery the market has leaned on for a decade.