|

USD/JPY Price Analysis: Slumps from weekly highs as bearish-engulfing candle pattern looms

  • USD/JPY trades with losses, ending its five-day gain amid a falling US Dollar and risk-averse mood.
  • A daily close below 138.17 could drive the pair further down, with 138.00 as the primary support.
  • USD/JPY needs to retake the 138.00 level to regain upward momentum, with resistances at 138.17 and 139.00.

USD/JPY forms a bearish-engulfing candlestick pattern, snapping five days of gains, down almost 0.60%, after hitting a weekly high of 138.74. Risk-off and a weaker US Dollar (USD), weighed on the USD/JPY pair. At the time of writing, the USD/JPY is trading at 137.90, below its opening price.

USD/JPY Price Analysis: Technical outlook

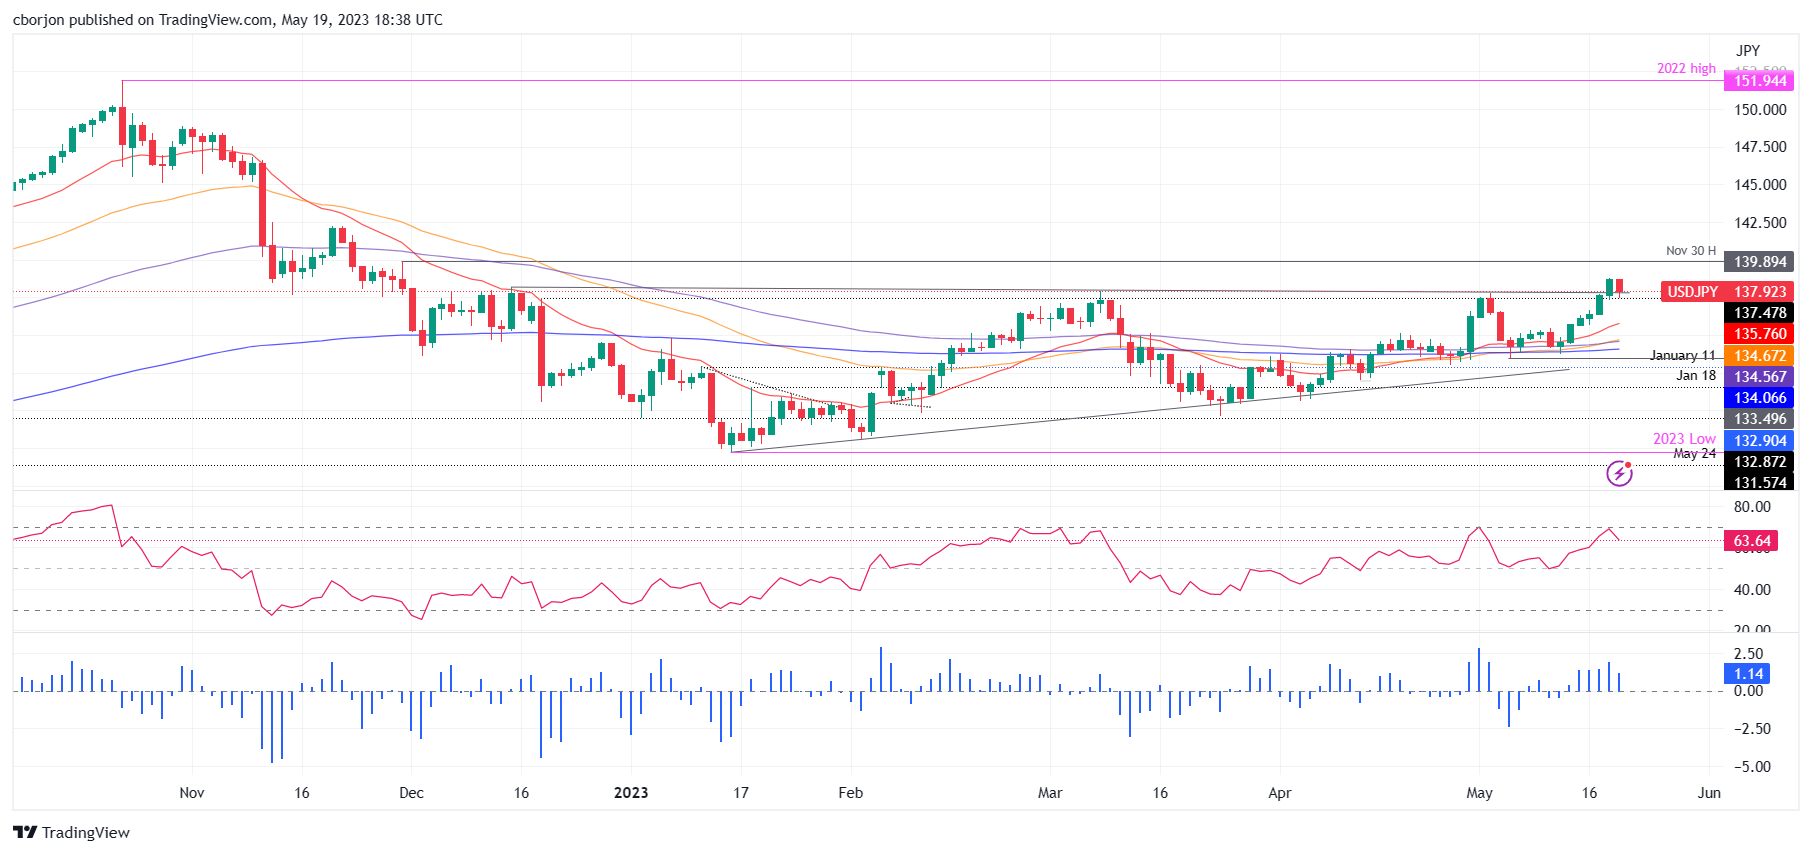
The USD/JPY remains upward biased, but a bearish candlestick formation could open the door for further losses. The Relative Strength Index (RSI) indicator remains in bullish territory but aims lower, which could put a lid on the USD/JPY fall. However, if USD/JPY achieves a daily close below the December 15 daily low of 138.17, that would exert downward pressure on the pair.

In that outcome, the USD/JPY first support would be 138.00. A breach of the latter will expose the May 18 daily low of 137.28, followed by the May 17 swing low at 136.30.

The USD/JPY must claim the 138.00 figure for a bullish resumption. Once done, the next resistance would be the December 15 high of 138.17, followed by the 139.00 figure. A rally above the latter will expose the November 30 high at 139.89, before challenging the 140.00 figure.

USD/JPY Price Action – Daily chart

USD/JPY Daily chart

USD/JPY

Overview
Today last price137.89
Today Daily Change-0.82
Today Daily Change %-0.59
Today daily open138.71
 
Trends
Daily SMA20135.38
Daily SMA50133.8
Daily SMA100133.07
Daily SMA200137.1
 
Levels
Previous Daily High138.75
Previous Daily Low137.29
Previous Weekly High135.77
Previous Weekly Low133.74
Previous Monthly High136.56
Previous Monthly Low130.63
Daily Fibonacci 38.2%138.19
Daily Fibonacci 61.8%137.85
Daily Pivot Point S1137.75
Daily Pivot Point S2136.79
Daily Pivot Point S3136.29
Daily Pivot Point R1139.21
Daily Pivot Point R2139.71
Daily Pivot Point R3140.66

Author

Christian Borjon Valencia

Christian Borjon began his career as a retail trader in 2010, mainly focused on technical analysis and strategies around it. He started as a swing trader, as he used to work in another industry unrelated to the financial markets.

More from Christian Borjon Valencia
Share:

Markets move fast. We move first.

Orange Juice Newsletter brings you expert driven insights - not headlines. Every day on your inbox.

By subscribing you agree to our Terms and conditions.

Editor's Picks

EUR/USD ticks lower following the release of FOMC Minutes

The US Dollar found some near-term demand following the release of the FOMC meeting minutes, with the EUR/USD pair currently piercing the 1.1750 threshold. The document showed officials are still willing to trim interest rates. Meanwhile, thinned holiday trading keeps major pairs confined to familiar levels.

GBP/USD remains sub- 1.3500, remains in the red

The GBP/USD lost traction early in the American session, maintaining the sour tone and trading around 1.3460 following the release of the FOMC meeting minutes. Trading conditions remain thin ahead of the New Year holiday, limiting the pair's volatility.

Gold stable above $4,350 as the year comes to an end

Gold price got to recover some modest ground on Tuesday, holding on to intraday gains and changing hands at $4,360 a troy ounce in the American afternoon. The bright metal showed no reaction to the release of the FOMC December meeting minutes.

Ethereum: ETH holds above $2,900 despite rising selling activity

Ethereum (ETH) held the $2,900 level despite seeing increased selling pressure over the past week. The Exchange Netflow metric showed deposits outweighed withdrawals by about 400K ETH. The high value suggests rising selling activity amid the holiday season.

Economic outlook 2026-2027 in advanced countries: Solidity test

After a year marked by global economic resilience and ending on a note of optimism, 2026 looks promising and could be a year of solid economic performance. In our baseline scenario, we expect most of the supportive factors at work in 2025 to continue to play a role in 2026.

Crypto market outlook for 2026

Year 2025 was volatile, as crypto often is.  Among positive catalysts were favourable regulatory changes in the U.S., rise of Digital Asset Treasuries (DAT), adoption of AI and tokenization of Real-World-Assets (RWA).