USD/JPY Price Analysis: Setup remains tilted firmly in favour of bearish traders


  • USD/JPY remains capped near a two-week-old descending trend-line hurdle.
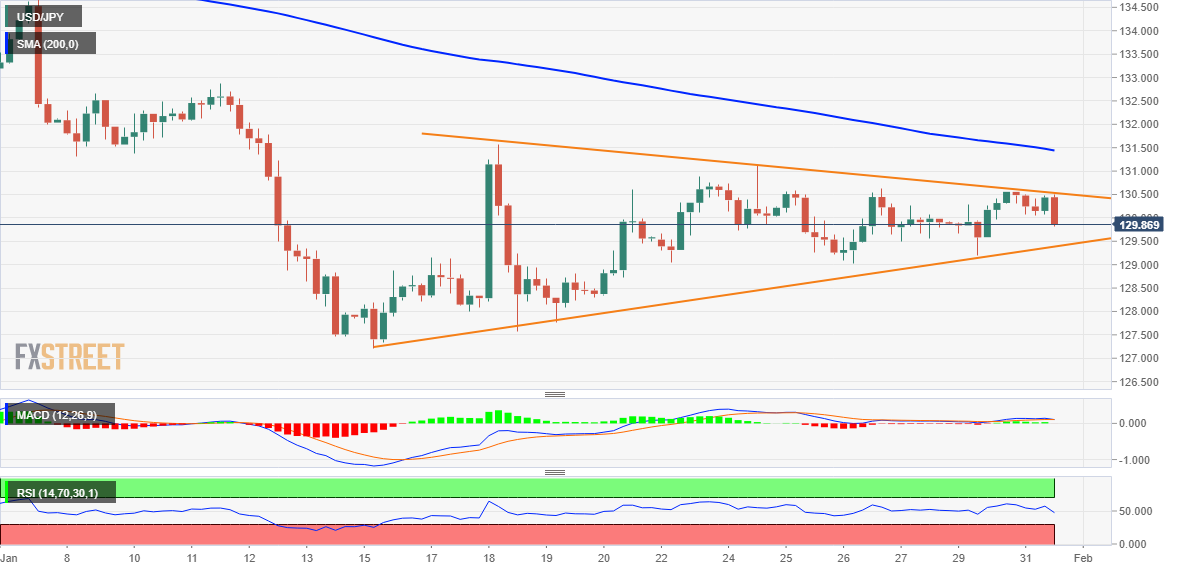
  • The formation of a bearish pennant supports prospects for a fresh leg down.
  • A sustained move beyond mid-130.00s is needed to negate the bearish outlook.

The USD/JPY pair struggles to capitalize on the previous day's rally of over 135 pips from the 129.20 area and oscillates in a narrow range through the early North American session on Tuesday.

From a technical perspective, a descending trend-line extending from January 18, currently around the 130.50 area, caps the upside for the USD/JPY pair. This, along with another upward-sloping trend line, constitutes the formation of a symmetrical triangle and points to a consolidation phase.

Given the recent sharp decline from over a three-decade high, the aforementioned triangle might now be categorized as a bearish pennant. This, in turn, favours bearish traders and supports prospects for the resumption of the well-established declining trend witnessed over the past three months or so.

That said, it will still be prudent to wait for a convincing break below the triangle support, 129.25 region, before placing fresh bearish bets. The USD/JPY pair might then turn vulnerable to weaken below the 129.00 mark and test intermediate support near the 128.75-128.70 horizontal zone.

The downward trajectory could get extended further towards the 128.00 round-figure mark, below which the USD/JPY pair seems all set to challenge the multi-month low, around the 127.20 zone touched on January 16.

That said, a sustained strength beyond mid-130.00s, or the top end of the symmetrical triangle, will negate the negative outlook and prompt some near-term short-covering rally. The USD/JPY pair might then accelerate the momentum towards the 131.00 mark, en route to the post-BoJ swing high, around the 131.55-131.60 area. Some follow-through buying should pave the way for additional near-term gains.

USD/JPY 4-hour chart

fxsoriginal

Key levels to watch

USD/JPY

Overview
Today last price 130.14
Today Daily Change -0.32
Today Daily Change % -0.25
Today daily open 130.46
 
Trends
Daily SMA20 130.37
Daily SMA50 133.6
Daily SMA100 139.34
Daily SMA200 136.77
 
Levels
Previous Daily High 130.57
Previous Daily Low 129.21
Previous Weekly High 131.12
Previous Weekly Low 129.02
Previous Monthly High 138.18
Previous Monthly Low 130.57
Daily Fibonacci 38.2% 130.05
Daily Fibonacci 61.8% 129.73
Daily Pivot Point S1 129.59
Daily Pivot Point S2 128.72
Daily Pivot Point S3 128.23
Daily Pivot Point R1 130.95
Daily Pivot Point R2 131.44
Daily Pivot Point R3 132.32


Share: Feed news

Information on these pages contains forward-looking statements that involve risks and uncertainties. Markets and instruments profiled on this page are for informational purposes only and should not in any way come across as a recommendation to buy or sell in these assets. You should do your own thorough research before making any investment decisions. FXStreet does not in any way guarantee that this information is free from mistakes, errors, or material misstatements. It also does not guarantee that this information is of a timely nature. Investing in Open Markets involves a great deal of risk, including the loss of all or a portion of your investment, as well as emotional distress. All risks, losses and costs associated with investing, including total loss of principal, are your responsibility. The views and opinions expressed in this article are those of the authors and do not necessarily reflect the official policy or position of FXStreet nor its advertisers. The author will not be held responsible for information that is found at the end of links posted on this page.

If not otherwise explicitly mentioned in the body of the article, at the time of writing, the author has no position in any stock mentioned in this article and no business relationship with any company mentioned. The author has not received compensation for writing this article, other than from FXStreet.

FXStreet and the author do not provide personalized recommendations. The author makes no representations as to the accuracy, completeness, or suitability of this information. FXStreet and the author will not be liable for any errors, omissions or any losses, injuries or damages arising from this information and its display or use. Errors and omissions excepted.

The author and FXStreet are not registered investment advisors and nothing in this article is intended to be investment advice.

Recommended content


Recommended content

Editors’ Picks

GBP/USD remains on the defensive below 1.2450 ahead of UK Retail Sales data

GBP/USD remains on the defensive below 1.2450 ahead of UK Retail Sales data

GBP/USD remains on the defensive near 1.2430 during the early Asian session on Friday. The downtick of the major pair is backed by the stronger US Dollar as the strong US economic data and hawkish remarks from the Fed officials have triggered the speculation that the US central bank will delay interest rate cuts to September.

GBP/USD News

EUR/USD extends its downside below 1.0650 on hawkish Fed remarks

EUR/USD extends its downside below 1.0650 on hawkish Fed remarks

The EUR/USD extends its downside around 1.0640 after retreating from weekly peaks of 1.0690 on Friday. The hawkish comments from Federal Reserve officials provide some support to the US Dollar.

EUR/USD News

Gold: Middle East war fears spark fresh XAU/USD rally, will it sustain?

Gold: Middle East war fears spark fresh XAU/USD rally, will it sustain?

Gold price is trading close to $2,400 early Friday, reversing from a fresh five-day high reached at $2,418 earlier in the Asian session. Despite the pullback, Gold price remains on track to book the fifth weekly gain in a row.

Gold News

Dogwifhat price pumps 5% ahead of possible Coinbase effect

Dogwifhat price pumps 5% ahead of possible Coinbase effect

Dogwifhat price recorded an uptick on Thursday, going as far as to outperform its peers in the meme coins space. Second only to Bonk Inu, WIF token’s show of strength was not just influenced by Bitcoin price reclaiming above $63,000.

Read more

Israel vs. Iran: Fear of escalation grips risk markets

Israel vs. Iran: Fear of escalation grips risk markets

Recent reports of an Israeli aerial bombardment targeting a key nuclear facility in central Isfahan have sparked a significant shift out of risk assets and into safe-haven investments. 

Read more

Forex MAJORS

Cryptocurrencies

Signatures