|

USD/JPY Price Analysis: Seesaws near the YTD high, around 136.20s

  • The USD/JPY printed a new YTD high and would test 137.00, achieving a daily close above 136.00.
  • The 20-DMA crossing above the 50-DMA exacerbated the USD/JPY Friday’s rally above 136.00.

The USD/JPY drops from around YTD highs around 136.55 and hits a daily low of 135.91 before reclaiming the 136.00 figure on Monday. At the time of writing, the USD/JPY falls 0.29%, trading at around 136.20s, underpinned by US bond yields, namely the 10-year benchmark note rate, down three basis points (bps) at 3.918%.

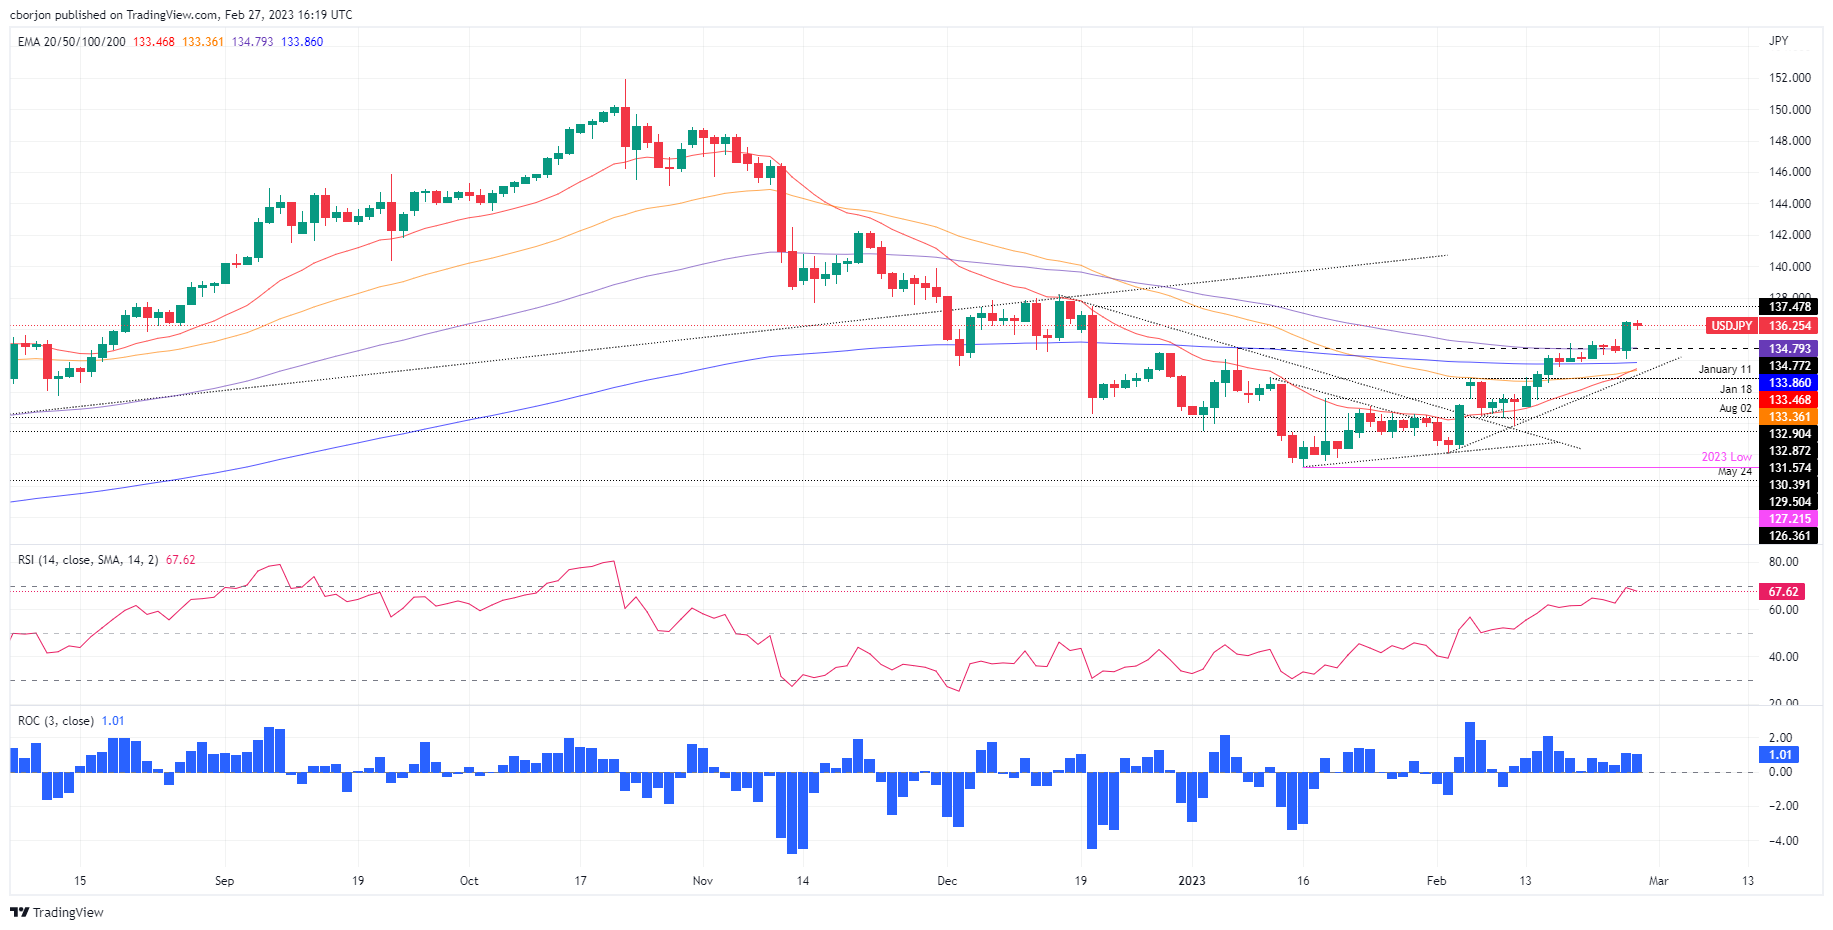
After breaking the year’s previous high at 134.77, the USD/JPY printed another leg-up to the new YTD high at 136.55 before aiming toward the current spot price. From a technical perspective, the USD/JPY is still upward biased, backed by the Relative Strength Index (RSI) in bullish territory and the Rate of Change (RoC), suggesting that in the last three days, buyers have emerged.

Also, the 100-day Exponential Moving Average (EMA) was the last solid resistance level at 134.79, which, once conquered, exacerbated a 160 pip rally to the new YTD  high. Traders should be aware that the 20-day EMA at 133.46 crossed above the 50-day EMA at 133.36. Hence, the USD/JPY could accelerate as the 20-day EMA closes the 200-day EMA At 133.86.

As the USD/JPY path of least resistance is upwards, the pair’s next ceiling level would be the 137.00 figure. Break above will expose the December 20 daily high of 137.47 before putting into play the December 15 high at 138.02. As an alternate scenario, the USD/JPY first support would be the 136.00 figure, ahead of today’s low at 135.91.

USD/JPY Daily chart

USD/JPY Key technical levels

USD/JPY

Overview
Today last price136.19
Today Daily Change-0.23
Today Daily Change %-0.17
Today daily open136.42
 
Trends
Daily SMA20132.51
Daily SMA50131.79
Daily SMA100137.16
Daily SMA200137.09
 
Levels
Previous Daily High136.52
Previous Daily Low134.06
Previous Weekly High136.52
Previous Weekly Low133.92
Previous Monthly High134.78
Previous Monthly Low127.22
Daily Fibonacci 38.2%135.58
Daily Fibonacci 61.8%135
Daily Pivot Point S1134.81
Daily Pivot Point S2133.2
Daily Pivot Point S3132.35
Daily Pivot Point R1137.27
Daily Pivot Point R2138.13
Daily Pivot Point R3139.73

Author

Christian Borjon Valencia

Christian Borjon began his career as a retail trader in 2010, mainly focused on technical analysis and strategies around it. He started as a swing trader, as he used to work in another industry unrelated to the financial markets.

More from Christian Borjon Valencia
Share:

Markets move fast. We move first.

Orange Juice Newsletter brings you expert driven insights - not headlines. Every day on your inbox.

By subscribing you agree to our Terms and conditions.

Editor's Picks

EUR/USD moves sideways below 1.1800 on Christmas Eve

EUR/USD struggles to find direction and trades in a narrow channel below 1.1800 after posting gains for two consecutive days. Bond and stock markets in the US will open at the usual time and close early on Christmas Eve, allowing the trading action to remain subdued. 

GBP/USD keeps range around 1.3500 amid quiet markets

GBP/USD keeps its range trade intact at around 1.3500 on Wednesday. The Pound Sterling holds the upper hand over the US Dollar amid pre-Christmas light trading as traders move to the sidelines heading into the holiday season. 

Gold retreats from record highs, trades below $4,500

Gold retreats after setting a new record-high above $4,520 earlier in the day and trades in a tight range below $4,500 as trading volumes thin out ahead of the Christmas break. The US Dollar selling bias remains unabated on the back of dovish Fed expectations, which continues to act as a tailwind for the bullion amid persistent geopolitical risks.

Bitcoin slips below $87,000 as ETF outflows intensify, whale participation declines

Bitcoin price continues to trade around $86,770 on Wednesday, after failing to break above the $90,000 resistance. US-listed spot ETFs record an outflow of $188.64 million on Tuesday, marking the fourth consecutive day of withdrawals.

Economic outlook 2026-2027 in advanced countries: Solidity test

After a year marked by global economic resilience and ending on a note of optimism, 2026 looks promising and could be a year of solid economic performance. In our baseline scenario, we expect most of the supportive factors at work in 2025 to continue to play a role in 2026.

Avalanche struggles near $12 as Grayscale files updated form for ETF

Avalanche trades close to $12 by press time on Wednesday, extending the nearly 2% drop from the previous day. Grayscale filed an updated form to convert its Avalanche-focused Trust into an ETF with the US Securities and Exchange Commission.