|

USD/JPY Price Analysis: Retraces after failing to crack the 200-DMA

  • Bullish momentum faded after the USD/JPY could not break resistance at the 200-DMA.
  • USD/JPY path of least resistance is downwards, with first support at 132.00.
  • A fall beyond 132.00, and the USD/JPY could test 131.00.

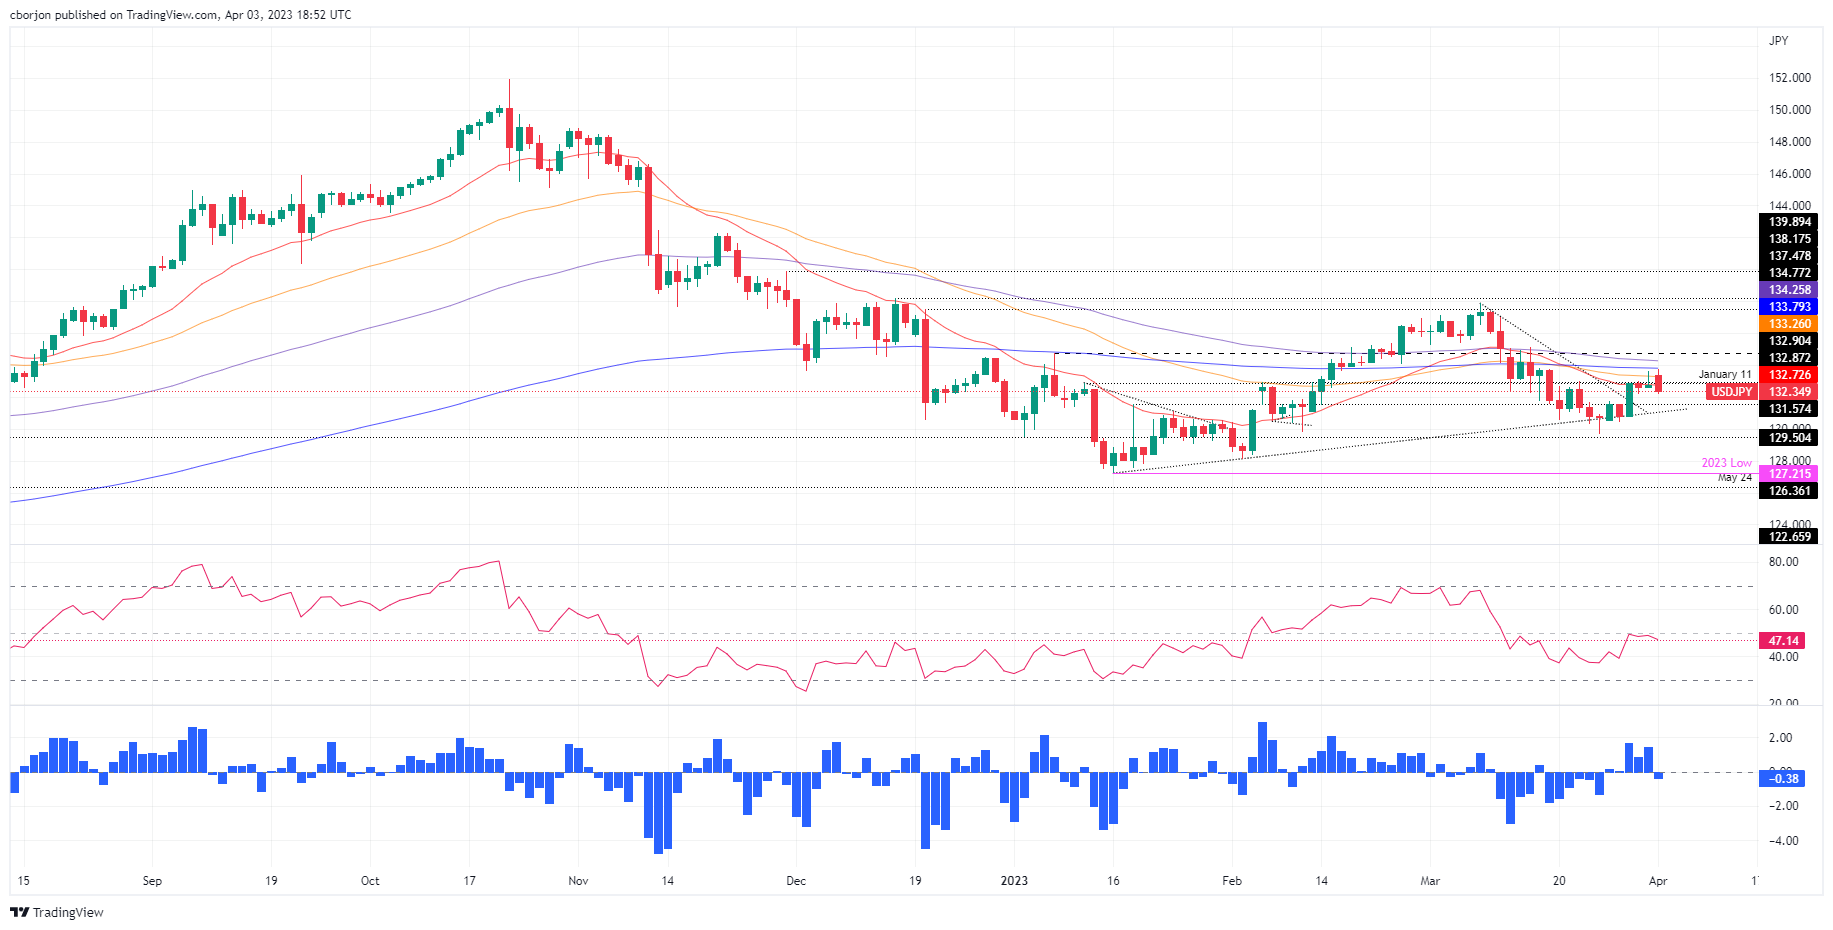
USD/JPY retraces from two-week highs at around 133.75 and extends its losses below the 50-day Exponential Moving Average (EMA) at 133.25 after failing to pierce the 200-day EMA at 133.79. At the time of writing, the USD/JPY is exchanging hands at 132.28, down 0.33%.

USD/JPY Price action

From the daily chart perspective, the USD/JPY bullish momentum waned after the pair fell shy of cracking the 200-day EMA. That would’ve exposed the 134.00 figure on the upside, followed by the 100-day EMA at 134.25.

Hence, the USD/JPY resumed its downtrend direction, exacerbated by back-to-back breaks of essential support levels, like the 50 and 20-day EMAs, at 133.25 and 132.72. Additionally, the Relative Strength Index (RSI) failed to crack the 50-mid-line and headed downwards, while the Rate of Change (RoC) began to portray that sellers were gathering momentum.

Therefore, the USD/JPY path of least resistance is downwards. That said, the USD/JPY first support would be 132.00. A breach of the latter will expose the March 27 high at 131.76, followed by an upslope support trendline drawn from January lows that passes around 131.10-20. Once cleared, 131.00 would be next.

USD/JPY Daily chart

USD/JPY Daily chart

USD/JPY Technical levels

USD/JPY

Overview
Today last price132.34
Today Daily Change-0.53
Today Daily Change %-0.40
Today daily open132.87
 
Trends
Daily SMA20133.27
Daily SMA50132.95
Daily SMA100133.87
Daily SMA200137.32
 
Levels
Previous Daily High133.6
Previous Daily Low132.59
Previous Weekly High133.6
Previous Weekly Low130.41
Previous Monthly High137.91
Previous Monthly Low129.64
Daily Fibonacci 38.2%133.21
Daily Fibonacci 61.8%132.97
Daily Pivot Point S1132.44
Daily Pivot Point S2132.01
Daily Pivot Point S3131.43
Daily Pivot Point R1133.45
Daily Pivot Point R2134.03
Daily Pivot Point R3134.46

Author

Christian Borjon Valencia

Christian Borjon began his career as a retail trader in 2010, mainly focused on technical analysis and strategies around it. He started as a swing trader, as he used to work in another industry unrelated to the financial markets.

More from Christian Borjon Valencia
Share:

Markets move fast. We move first.

Orange Juice Newsletter brings you expert driven insights - not headlines. Every day on your inbox.

By subscribing you agree to our Terms and conditions.

Editor's Picks

EUR/USD steadies near 1.1750 ahead of final Eurozone CPI amid fading USD recovery

The EUR/USD pair steadies around the 1.1750 area during the Asian session on Wednesday, and for now, seems to have stalled the previous day's sharp retracement slide from the highest level since September 24. Meanwhile, the fundamental backdrop remains tilted in favor of bullish traders and suggests that the path of least resistance for spot prices remains to the upside.

GBP/USD gains ground above 1.3400 on UK PMI optimism

The GBP/USD pair gains momentum to around 1.3425 during the early Asian session on Wednesday. The Pound Sterling edges higher against the Greenback on the upbeat UK preliminary S&P Global Purchasing Managers' Index data. Traders will take more cues from the Fedspeak later on Wednesday. 

Gold advances to near seven-week highs amid US labor market cooling

Gold price extends its upside to near seven-week highs above $4,300 during the Asian trading hours on Wednesday. The precious metal gains momentum as the US labor market remains relatively resilient but shows signs of slowing. The mixed US employment report for November reinforces bets of further rate cuts by the US Federal Reserve and weighs on the US Dollar.

Top Crypto Gainers: SPX6900, Pi Network, Filecoin – Sudden rebound lifts bullish spirit

SPX6900, Pi Network, and Filecoin emerge as top gainers in the last 24 hours as the broader cryptocurrency market remains under bearish pressure. The sudden rebound in SPX, PI, and FIL suggests a possible rally, as the Moving Average Convergence Divergence indicator on the 4-hour chart flashes a buy signal. 

Ukraine-Russia in the spotlight once again

Since the start of the week, gold’s price has moved lower, but has yet to erase the gains made last week. In today’s report we intend to focus on the newest round of peace talks between Russia and Ukraine, whilst noting the release of the US Employment data later on day and end our report with an update in regards to the tensions brewing in Venezuela.

BNB Price Forecast: BNB slips below $855 as bearish on-chain signals and momentum indicators turn negative

BNB, formerly known as Binance Coin, continues to trade down around $855 at the time of writing on Tuesday, after a slight decline the previous day. Bearish sentiment further strengthens as BNB’s on-chain and derivatives data show rising retail activity.