|

USD/JPY Price Analysis: Remains below the 200-DMA, albeit reclaiming 134.00

  • USD/JPY is back above 134.00, eyeing a challenge of the 200-day EMA.
  • The major is consolidated around 130.50/134.40 after dropping below the 200-day EMA.
  • USD/JPY Price Analysis: Minor divergence between price action and the RoC suggests a fall below 134.00.

The USD/JPY has advanced steadily since the December 20 500-pip fall after the Bank of Japan (BoJ) removed the cap of 0.25% to the 10-year Japanese Government Bond (JGB), catching traders off guard. Therefore, the Japanese Yen (JPY) strengthened, though it has erased some of its gains. At the time of writing, the USD/JPY is trading at 134.17, up by 0.54%.

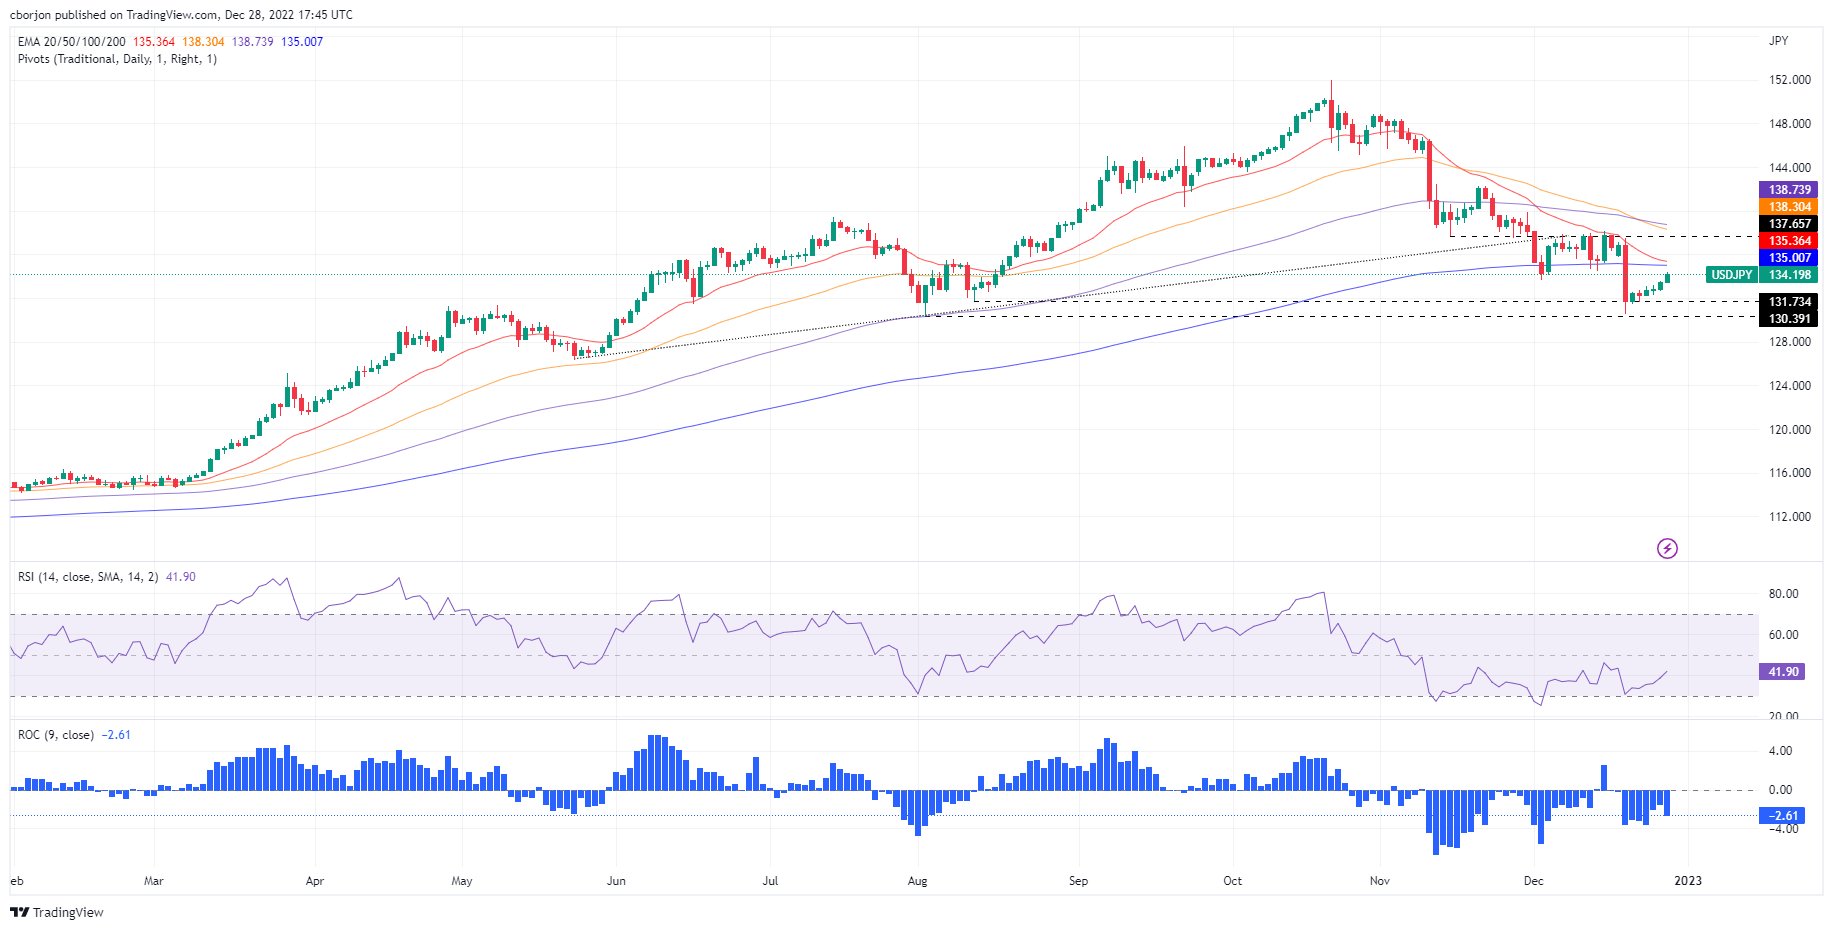
USD/JPY Price Analysis: Technical outlook

The USD/JPY daily chart shows the pair edged below the 200-day Exponential Moving Average (EMA), opening the door for further losses. Since then, the USD/JPY consolidated at around the 130.50/134.40 range, due to light liquidity conditions, amidst the last trading week of 2022. The Relative Strength Index (RSI) is in bearish territory, while the Rate of Chance (RoC) suggests that sellers are gathering momentum, even though the USD/JPY reached higher highs. Therefore, a minor divergence between price action and the RoC could pave the way for further losses in the USD/JPY.

If the USD/JPY fails to clear the 200-day EMA at 135.00, the next support would be the 134.00 mark. Break below will expose the December 27 daily low of 132.63, followed by the August 11 swing low of 131.73.

An alternate scenario, if the USD/JPY clears the 200-day EMA, that could pave the way towards November 15 swing low-turned-resistance at 137.65, though it would face some resistance on its way north, like the 136.00 figure.

USD/JPY Key Technical Levels

USD/JPY

Overview
Today last price134.08
Today Daily Change0.54
Today Daily Change %0.40
Today daily open133.54
 
Trends
Daily SMA20135.36
Daily SMA50140.54
Daily SMA100141.11
Daily SMA200136.06
 
Levels
Previous Daily High133.6
Previous Daily Low132.64
Previous Weekly High137.48
Previous Weekly Low130.57
Previous Monthly High148.82
Previous Monthly Low137.5
Daily Fibonacci 38.2%133.23
Daily Fibonacci 61.8%133
Daily Pivot Point S1132.92
Daily Pivot Point S2132.3
Daily Pivot Point S3131.96
Daily Pivot Point R1133.88
Daily Pivot Point R2134.22
Daily Pivot Point R3134.84

Author

Christian Borjon Valencia

Christian Borjon began his career as a retail trader in 2010, mainly focused on technical analysis and strategies around it. He started as a swing trader, as he used to work in another industry unrelated to the financial markets.

More from Christian Borjon Valencia
Share:

Markets move fast. We move first.

Orange Juice Newsletter brings you expert driven insights - not headlines. Every day on your inbox.

By subscribing you agree to our Terms and conditions.

Editor's Picks

EUR/USD rebounds after falling toward 1.1700

EUR/USD gains traction and trades above 1.1730 in the American session, looking to end the week virtually unchanged. The bullish opening in Wall Street makes it difficult for the US Dollar to preserve its recovery momentum and helps the pair rebound heading into the weekend.

GBP/USD steadies below 1.3400 as traders assess BoE policy outlook

Following Thursday's volatile session, GBP/USD moves sideways below 1.3400 on Friday. Investors reassess the Bank of England's policy oıtlook after the MPC decided to cut the interest rate by 25 bps by a slim margin. Meanwhile, the improving risk mood helps the pair hold its ground.

Gold stays below $4,350, looks to post small weekly gains

Gold struggles to gather recovery momentum and stays below $4,350 in the second half of the day on Friday, as the benchmark 10-year US Treasury bond yield edges higher. Nevertheless, the precious metal remains on track to end the week with modest gains as markets gear up for the holiday season.

Crypto Today: Bitcoin, Ethereum, XRP rebound amid bearish market conditions

Bitcoin (BTC) is edging higher, trading above $88,000 at the time of writing on Monday. Altcoins, including Ethereum (ETH) and Ripple (XRP), are following in BTC’s footsteps, experiencing relief rebounds following a volatile week.

How much can one month of soft inflation change the Fed’s mind?

One month of softer inflation data is rarely enough to shift Federal Reserve policy on its own, but in a market highly sensitive to every data point, even a single reading can reshape expectations. November’s inflation report offered a welcome sign of cooling price pressures. 

XRP rebounds amid ETF inflows and declining retail demand demand

XRP rebounds as bulls target a short-term breakout above $2.00 on Friday. XRP ETFs record the highest inflow since December 8, signaling growing institutional appetite.