|

USD/JPY Price Analysis: Remains depressed near 109.30-25 area ahead of US data

  • USD/JPY edged lower for the second straight day amid renewed USD selling bias.
  • Any meaningful decline might find decent support near the 108.80 confluence.
  • A sustained move beyond the 109.65-70 area is needed to confirm additional gains.

The USD/JPY pair struggled to capitalize on its early uptick, instead met with some fresh supply near the 109.65 region and turned lower for the second consecutive session on Friday. The pair remained on the defensive through the mid-European session and was last seen trading around the 109.35-30 region, down over 0.10% for the day.

Retreating US Treasury bond yields – amid dovish Fed expectations – acted as a headwind for the US dollar and exerted some downward pressure on the USD/JPY pair. That said, a generally positive tone around the global equity markets undermined the safe-haven Japanese yen and helped limit any further losses, at least for now.

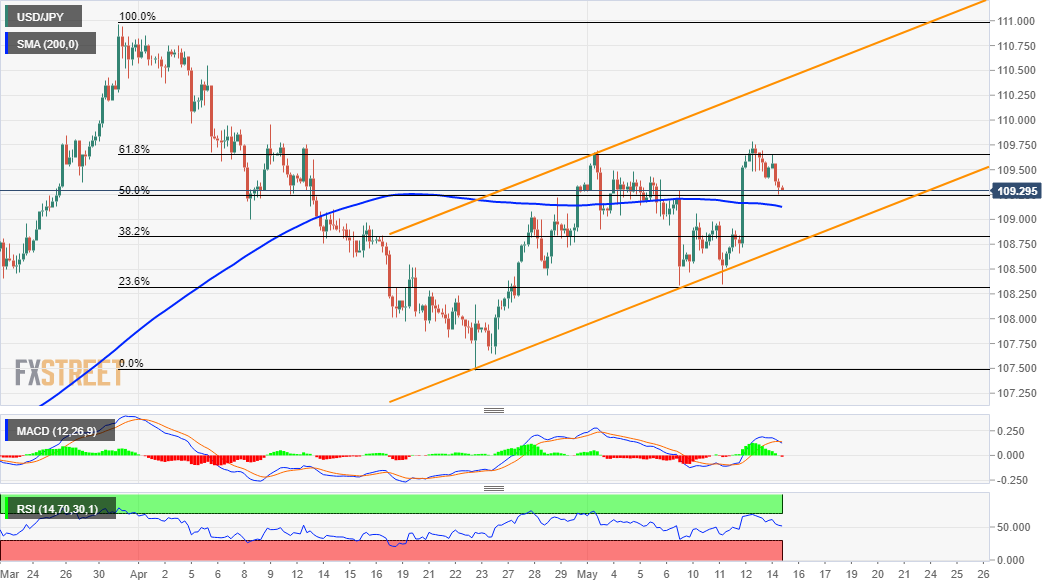
From a technical perspective, the USD/JPY pair stalled this week's goodish rebound from the 108.35 region near a resistance marked by the 61.8% Fibonacci level of the 110.97-107.48 downfall. The mentioned area should now act as a key pivotal point for traders and help determine the next leg of a directional move.

Meanwhile, the downside remained limited and the USD/JPY pair, so far, has managed to hold its neck above the 109.20-15 confluence support. This comprises 50% Fibo. level and 200-period SMA on the 4-hour chart, which if broken decisively might prompt some technical selling and turn the pair vulnerable to slide further.

The next relevant support is pegged near the 109.00 mark ahead of the 108.80 region, marking the 38.2% Fibo. level. The latter coincides with the lower boundary of a near four-week-old ascending channel. Sustained weakness below will be seen as a fresh trigger for bearish traders and pave the way for a further depreciating move.

On the flip side, the 109.65-70 region might continue to act as immediate strong resistance. Some follow-through buying beyond the weekly swing highs, around the 109.80 level, has the potential to lift the USD/JPY pair further beyond the key 110.00 psychological mark, towards the trend-channel hurdle, currently around the 110.35-40 area.

USD/JPY 4-hour chart
fxsoriginal

Technical levels to watch

USD/JPY

Overview
Today last price109.32
Today Daily Change-0.16
Today Daily Change %-0.15
Today daily open109.48
 
Trends
Daily SMA20108.74
Daily SMA50109.06
Daily SMA100106.85
Daily SMA200105.95
 
Levels
Previous Daily High109.78
Previous Daily Low109.41
Previous Weekly High109.7
Previous Weekly Low108.34
Previous Monthly High110.85
Previous Monthly Low107.48
Daily Fibonacci 38.2%109.55
Daily Fibonacci 61.8%109.64
Daily Pivot Point S1109.33
Daily Pivot Point S2109.18
Daily Pivot Point S3108.95
Daily Pivot Point R1109.71
Daily Pivot Point R2109.93
Daily Pivot Point R3110.08

Author

Haresh Menghani

Haresh Menghani is a detail-oriented professional with 10+ years of extensive experience in analysing the global financial markets.


More from Haresh Menghani
Share:

Editor's Picks

AUD/USD climbs toward 0.7000 after strong China data dump

AUD/USD attracts follow-through buyers for the second straight day on Monday, extending last week's recovery toward 0.7000 in Monday's Asian trading. Strong Chniese Q3 GDP and activity data for September strengthen the pair's advance, following RBA Assistant Governor Chris Kent's hawkish remarks.

USD/JPY struggles near 158.00 amid hawkish BoJ, subdued USD

USD/JPY remains defensive near 158.00 in the Asian session on Monday, as the US Dollar remains depressed near a two-week low amid the recent decline in US bond yields. Furthermore, looming intervention risks underpin the Japanese Yen and weigh on the pair amid BoJ Governor Kazuo Ueda's hawkish remarks. However, Fed rate-hike bets and geopolitical uncertainties could limit USD losses and the major.

Gold bulls hesitant below $4,200 as Fed risks and firmer USD cap intraday gains

Gold struggles to capitalize on modest intraday gains and remains below the $4,200 mark, well within a three-week-old trading range. US Federal Reserve Chair Kevin Warsh’s unwillingness to offer fresh cues on further policy moves forced investors to price out the possibility of policy tightening later this month. Moreover, the recent sharp pullback in US government bond yields from multi-year highs, which dragged the US Dollar to a two-week low on Friday, acts as a tailwind for bullion.

Pi Network: Weak momentum and waning demand reinforce downside bias

Pi Network edges lower, risking a bearish conclusion to its short-term consolidation above the $0.0774 horizontal support. A steady decline in the notional value of active PI futures contracts and the weekly spot trading volume suggests reduced retail demand. The PI token risks a retest of its record low around $0.0704 as bearish momentum remains dominant on the daily chart.

Canada CPI expected to show a pick-up in inflation in September

Canada’s September CPI figures will be the focus of attention on Monday. Indeed, Statistics Canada data will provide markets with an update on price pressures ahead of the BoC’s October 28 gathering, when officials are expected to keep the interest rate steady at 2.25%, broadly in line with analyst consensus.

Everyone's dumping Gold after hot US inflation. Here's why $4,100 could be a floor, not a cliff
Gold (XAU/USD) is recovering from a sharp sell-off triggered by hotter-than-expected United States (US) inflation data released on Wednesday. The precious metal briefly plunged toward $4,073 as investors increased their bets on further Federal Reserve (Fed) interest rate hikes before recovering as US Treasury yields and the US Dollar (USD) reversed their initial gains.