|

USD/JPY Price Analysis: Rally inspired by continuation of BoJ’s ultra-dovish policy approaches 135.00

  • USD/JPY has jumped swiftly to near 135.00 as BoJ has announced a continuation of ultra-dovish monetary policy.
  • The USD Index has jumped above 101.76 amid a delay in US debt-ceiling proposal and pre-Fed policy anxiety.
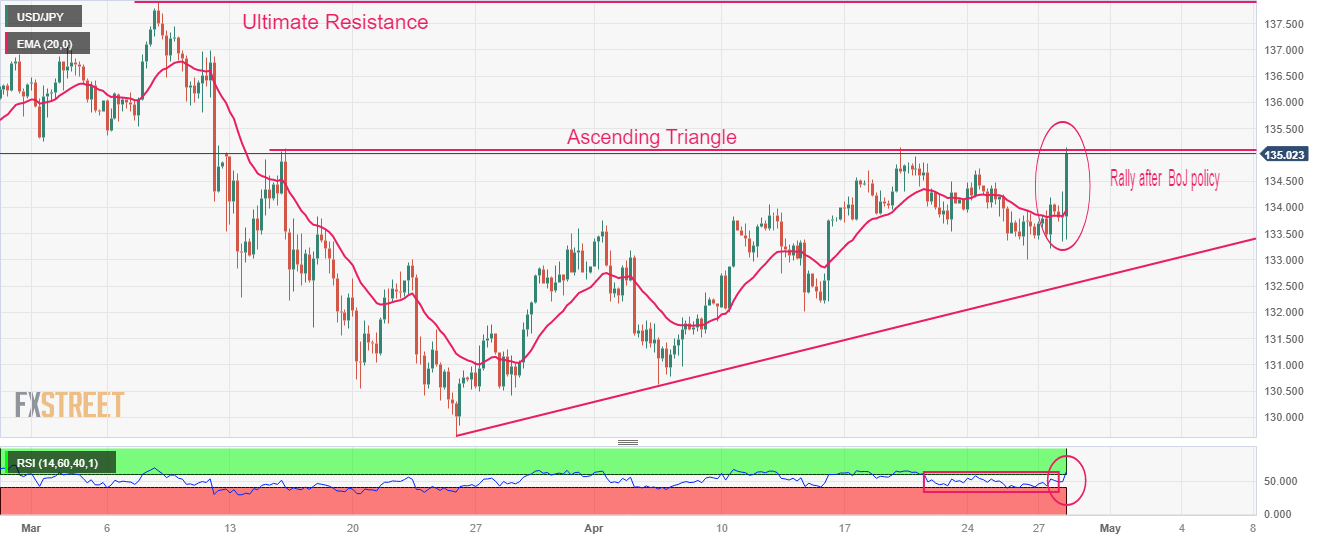
  • USD/JPY is on the verge of delivering a breakout of the Ascending Triangle pattern.

The USD/JPY pair has scaled quickly to near the crucial resistance of 135.00 after the Bank of Japan (BoJ) announced a continuation of ultra-loose monetary policy and stability in Japanese Government Bonds’ (JGBs) yields band to maintain an expansionary policy stance. BoJ Governor Kazuo Ueda has confirmed that the central bank will take additional easing steps without hesitation as needed while striving for market stability.

S&P500 futures have recovered the majority of losses generated in the Asian session, portraying a recovery in appeal for US equities as investors are cheerful from solid quarterly performances by technology companies.

The US Dollar Index (DXY) has refreshed its day high at 101.76 amid a delay in US debt-ceiling proposal and pre-Federal Reserve (Fed) policy anxiety among the market participants.

On a four-hour scale, USD/JPY is near the edge of the horizontal resistance of the Ascending Triangle chart pattern plotted from March 15 high at 135.12. The upward-sloping trendline of the aforementioned chart pattern is placed from March 24 low at 129.64.

The 20-period Exponential Moving Average (EMA) below 134.00 has got highly diverged from the major, indicating solid strength in the upside bias.

Meanwhile, the Relative Strength Index (RSI) (14) has climbed above 60.00, which signals that the bullish momentum has been triggered.

Going forward, a decisive break above March 06 low at 135.37 will drive the major toward March 10 high at 137.00 followed by the ultimate resistance plotted from March 08 high at 137.91.

On the contrary, a break below April 05 low at 130.63 would drag the asset toward the round-level support of 130.00. A break below the 130.00 support would expose the asset to March 24 low at 129.64.

USD/JPY four-hour chart

USD/JPY

Overview
Today last price134.98
Today Daily Change1.03
Today Daily Change %0.77
Today daily open133.95
 
Trends
Daily SMA20133.32
Daily SMA50133.79
Daily SMA100132.89
Daily SMA200136.99
 
Levels
Previous Daily High134.2
Previous Daily Low133.21
Previous Weekly High135.14
Previous Weekly Low133.55
Previous Monthly High137.91
Previous Monthly Low129.64
Daily Fibonacci 38.2%133.82
Daily Fibonacci 61.8%133.59
Daily Pivot Point S1133.37
Daily Pivot Point S2132.8
Daily Pivot Point S3132.39
Daily Pivot Point R1134.36
Daily Pivot Point R2134.77
Daily Pivot Point R3135.34

Author

Sagar Dua

Sagar Dua

FXStreet

Sagar Dua is associated with the financial markets from his college days. Along with pursuing post-graduation in Commerce in 2014, he started his markets training with chart analysis.

More from Sagar Dua
Share:

Editor's Picks

GBP/USD surges to multi-day peaks past 1.3250

GBP/USD leaves behind Friday’s small pullback and advances past 1.3250 level, or five-day highs, on Monday. Cable’s upside follows extra losses in the Greenback, while traders continue to assess the geopolitical front and upcoming key events.

EUR/USD picks up extra pace north of 1.1400

EUR/USD extends its recovery past 1.1400 the figure as the NA session draws to a close on Monday. Indeed, the pair advances for the third straight day amid the persistent offered bias in the US Dollar. Meanwhile, market participants keep gearing up for the ECB Forum in Sintra and the release of critical US labour market data.

Gold bears flirt with $4,000 as Iran tensions and Fed hike bets support USD

Gold remains under some selling pressure for the second straight day on Tuesday, with bears awaiting a sustained break below $4,000 before positioning for deeper losses. Renewed US-Iran hostilities over the weekend cast doubts over the sustainability of the peace deal. This, along with elevated expectations for Fed rate hikes, offers some support to the US Dollar and keeps the bullion within striking distance of the YTD low, touched last week.

Bitcoin stalls at $60K as buyer conviction fades, Strategy authorizes BTC sales

Bitcoin is trading around the $60,000 level on Monday after a sharp decline last week. With the top crypto struggling to recover, analysts suggest the market remains firmly in defensive territory as investors await stronger signs of demand.

Just like Fed, is BoJ’s independence under threat?

When talking about central bank independence, most of the focus has been on Donald Trump’s pressure on the Federal Reserve. But a similar story, a quieter one for now, seems to be happening on the other side of the Pacific: Japan’s government may be testing the Bank of Japan’s independence.

Kevin Warsh isn't expected to say much in Sintra: That's exactly why markets will listen

Financial markets could find an important catalyst in the enchanting, fairytale-like landscape of Sintra this week. The ECB Forum will, as it does every year, gather the crème de la crème of central banks. The new boss at the Fed, who has clearly said that the Fed should stop explaining everything, will need to talk – and traders should listen.