- USD/JPY plummets to a fresh multi-month low on Friday amid sustained USD selling bias.
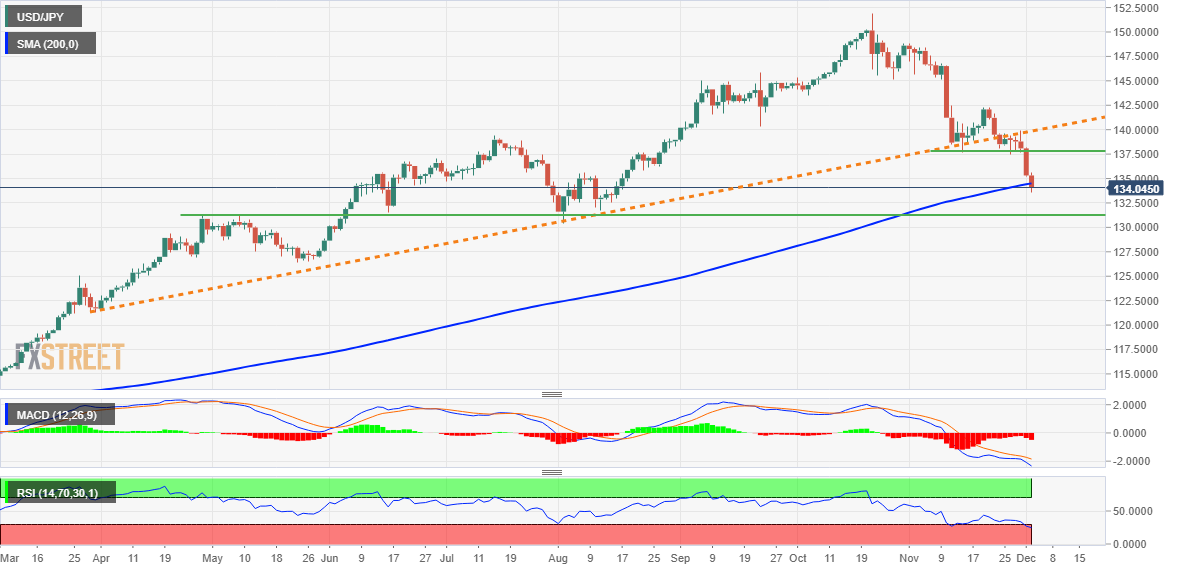
- A break and acceptance below the 200-day SMA support prospects for additional losses.
- The bearish pressure, however, abates amid oversold conditions and ahead of the NFP.
The USD/JPY pair prolongs its bearish trend for the fifth straight day on Friday - also marking the ninth day of a negative move in the previous ten and dives to its lowest level since August 16. The pair now seems to have entered a bearish consolidation phase and is seen hovering around the 134.00 mark as traders await the US NonFarm Payrolls (NFP) report for a fresh impetus.
The relentless US Dollar selling remains unabated amid growing acceptance that the US Federal Reserve will slow the pace of its rate-hiking cycle. Apart from this, the recent sharp decline in the US Treasury bond yields narrows the US-Japan rate differential, which benefits the Japanese Yen. This, along with the overnight hawkish signals by the Bank of Japan board member Asahi Noguchi contributes to the heavily offered tone surrounding the USD/JPY pair.
From a technical perspective, this week's downfall confirmed a breakdown through an upward sloping trend-line extending from late March. A subsequent slide below the 137.65-137.50 horizontal support and the 135.00 psychological mark zone is seen as a fresh trigger for bearish traders. Moreover, acceptance below the very important 200-day Simple Moving Average (SMA) supports prospects for an extension of the recent depreciating move for the USD/JPY pair.
That said, oscillators on short-term charts are already flashing oversold conditions and warrant some caution. Nevertheless, the USD/JPY pair seems poised to weaken further towards testing sub-133.00 levels. The downward trajectory could eventually drag spot prices below the 132.00 round figure, towards the next relevant support near the 131.50 area en route to the 131.00 mark and the August swing low, around the 130.40-130.35 zone.
On the flip side, the 200-day SMA, currently around the 134.50 region, could act as an immediate strong resistance ahead of the 135.00 mark. A sustained move beyond might trigger a short-covering rally and allow the USD/JPY pair to reclaim the 136.00 round figure. Any subsequent move up, however, is more likely to attract fresh sellers and remain capped near the 136.70 support breakpoint, which should act now act as a pivotal point.
USD/JPY daily chart
Key levels to watch
Information on these pages contains forward-looking statements that involve risks and uncertainties. Markets and instruments profiled on this page are for informational purposes only and should not in any way come across as a recommendation to buy or sell in these assets. You should do your own thorough research before making any investment decisions. FXStreet does not in any way guarantee that this information is free from mistakes, errors, or material misstatements. It also does not guarantee that this information is of a timely nature. Investing in Open Markets involves a great deal of risk, including the loss of all or a portion of your investment, as well as emotional distress. All risks, losses and costs associated with investing, including total loss of principal, are your responsibility. The views and opinions expressed in this article are those of the authors and do not necessarily reflect the official policy or position of FXStreet nor its advertisers. The author will not be held responsible for information that is found at the end of links posted on this page.
If not otherwise explicitly mentioned in the body of the article, at the time of writing, the author has no position in any stock mentioned in this article and no business relationship with any company mentioned. The author has not received compensation for writing this article, other than from FXStreet.
FXStreet and the author do not provide personalized recommendations. The author makes no representations as to the accuracy, completeness, or suitability of this information. FXStreet and the author will not be liable for any errors, omissions or any losses, injuries or damages arising from this information and its display or use. Errors and omissions excepted.
The author and FXStreet are not registered investment advisors and nothing in this article is intended to be investment advice.
Recommended content
Editors’ Picks
EUR/USD clings to daily gains above 1.0650
EUR/USD gained traction and turned positive on the day above 1.0650. The improvement seen in risk mood following the earlier flight to safety weighs on the US Dollar ahead of the weekend and helps the pair push higher.
GBP/USD recovers toward 1.2450 after UK Retail Sales data
GBP/USD reversed its direction and advanced to the 1.2450 area after touching a fresh multi-month low below 1.2400 in the Asian session. The positive shift seen in risk mood on easing fears over a deepening Iran-Israel conflict supports the pair.
Gold holds steady at around $2,380 following earlier spike
Gold stabilized near $2,380 after spiking above $2,400 with the immediate reaction to reports of Israel striking Iran. Meanwhile, the pullback seen in the US Treasury bond yields helps XAU/USD hold its ground.
Bitcoin Weekly Forecast: BTC post-halving rally could be partially priced in Premium
Bitcoin price shows no signs of directional bias while it holds above $60,000. The fourth BTC halving is partially priced in, according to Deutsche Bank’s research.
Week ahead – US GDP and BoJ decision on top of next week’s agenda
US GDP, core PCE and PMIs the next tests for the Dollar. Investors await BoJ for guidance about next rate hike. EU and UK PMIs, as well as Australian CPIs also on tap.