|
USD/JPY Price Analysis: Greenback trades near session’s highs, bulls eying the 109.00 handle
- USD/JPY is reversing the decline which started in the first days of January.
- The level to beat for bulls is the 109.00 handle.

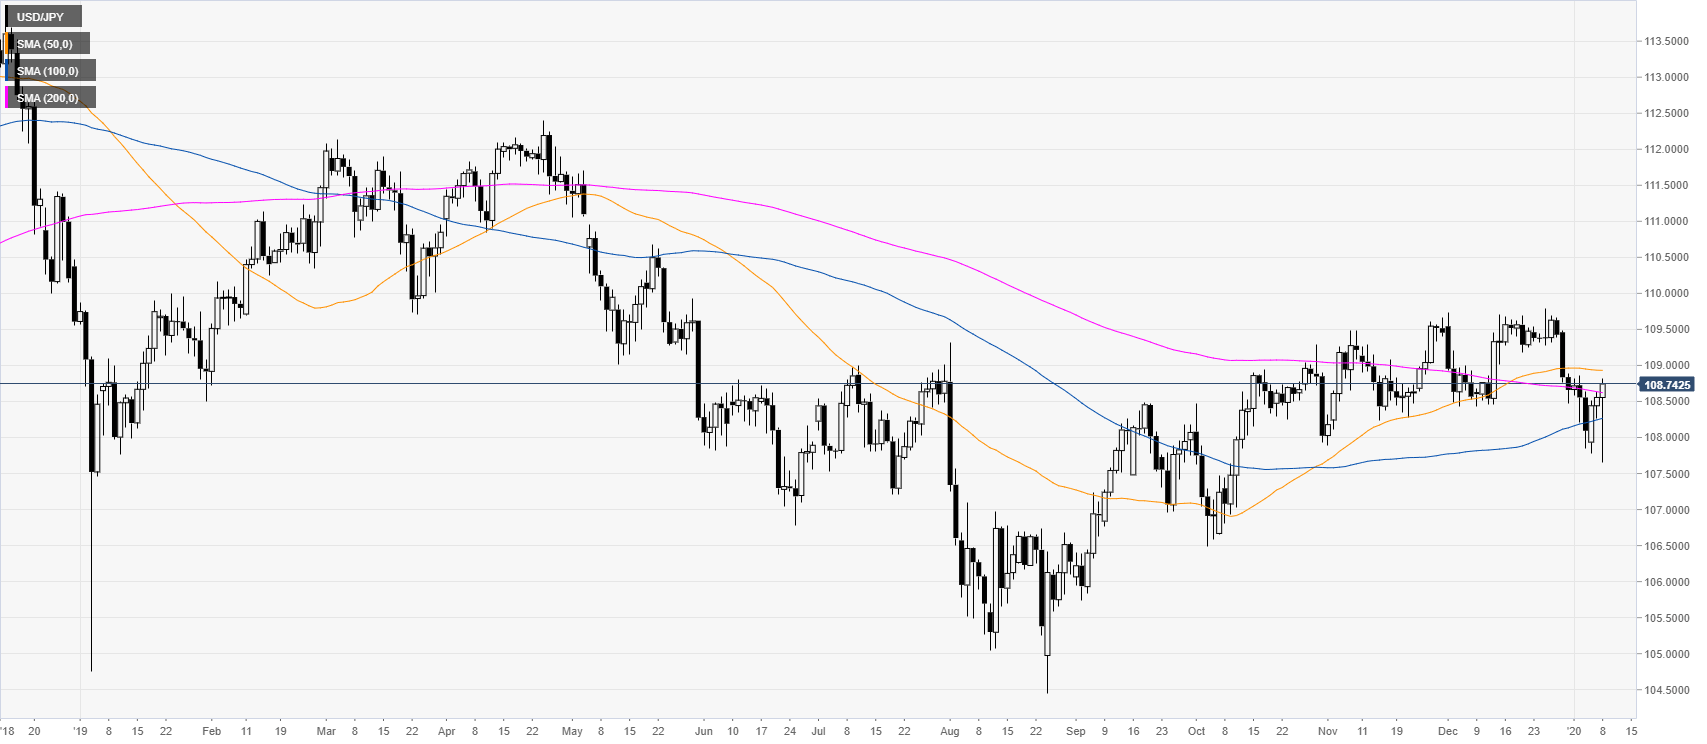
USD/JPY daily chart
USD/JPY is bouncing from the 108.00 handle and the 100-day simple moving average (SMA). The market is now challenging the 200-day simple moving average (SMA).
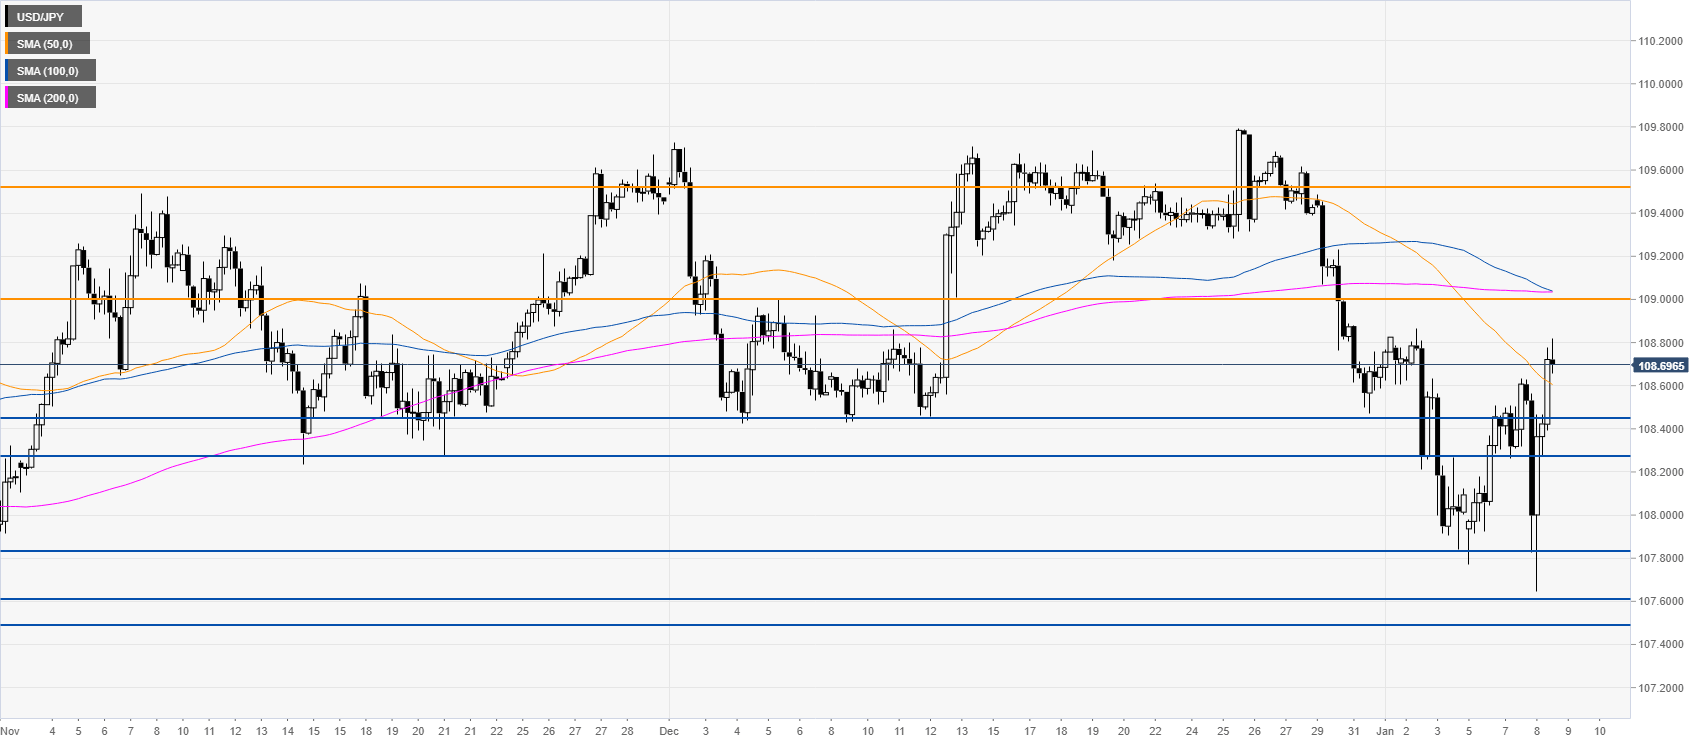
USD/JPY four-hour chart
The market is gaining ground above the 108.45 support and the 50 SMA on the four-hour chart. Bulls are gaining momentum and probably want to reach the 109.00 handle, which is likely going to act as resistance. If the market can surpass that level, the next level to watch is likely the 109.52 level on the way up. The spot is expected to meet support near the 108.45/28 price zone, 107.83 and 107.61/49 support zone, according to the Technical Confluences Indicator.
Additional key levels
Author

Flavio Tosti
Independent Analyst
More from Flavio Tosti


