|
USD/JPY price analysis: Greenback trades at daily lows against yen, sub-109.00 handle
- USD/JPY remains vulnerable below the 109.00 figure in the New York session.
- The 106.59 support is on the bear's radar.

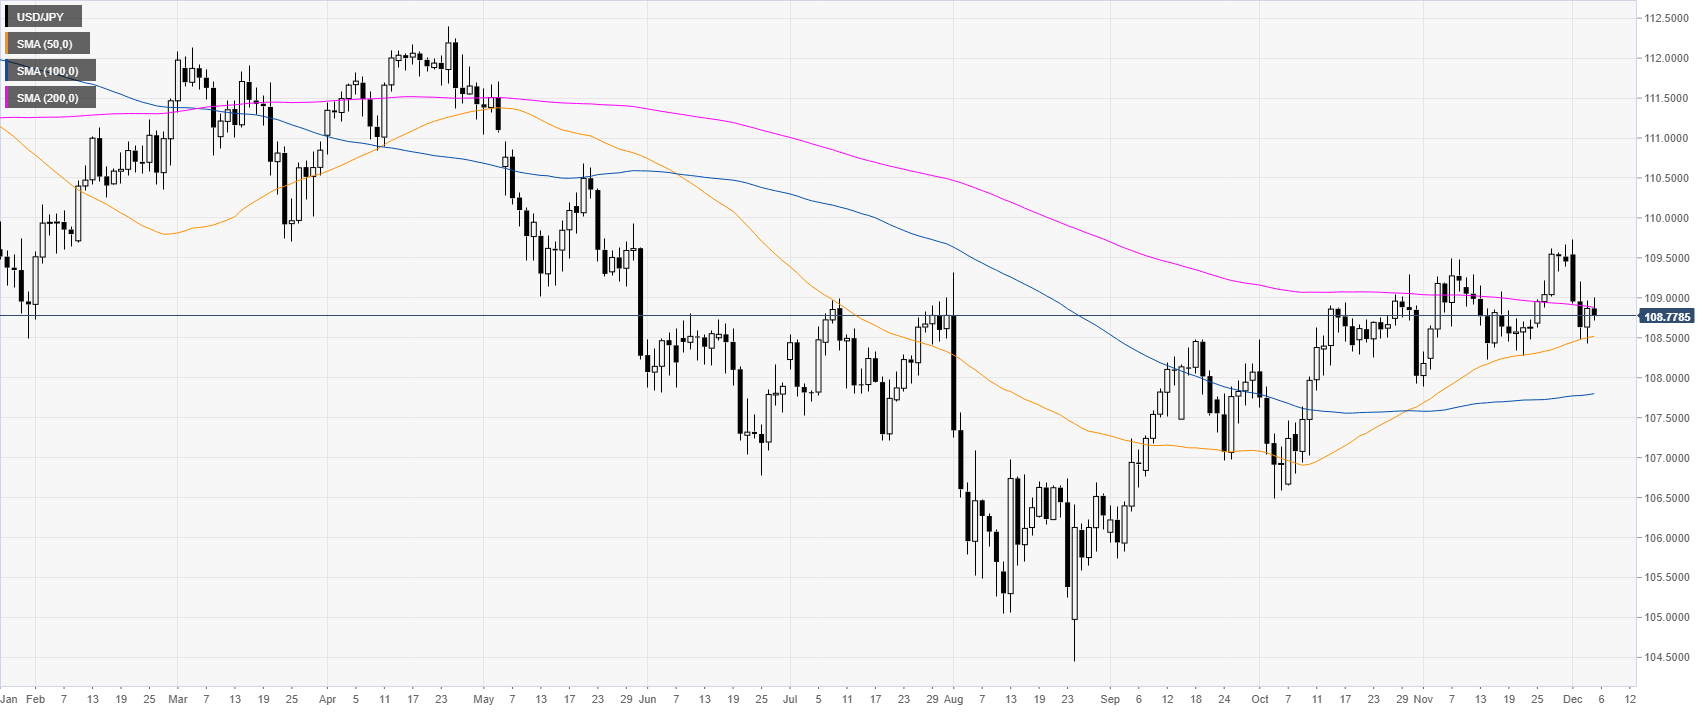
USD/JPY daily chart
USD/JPY is correcting the recent drop below the 109.00 figure and the 200-day simple moving average (DMA) on the daily time frame.
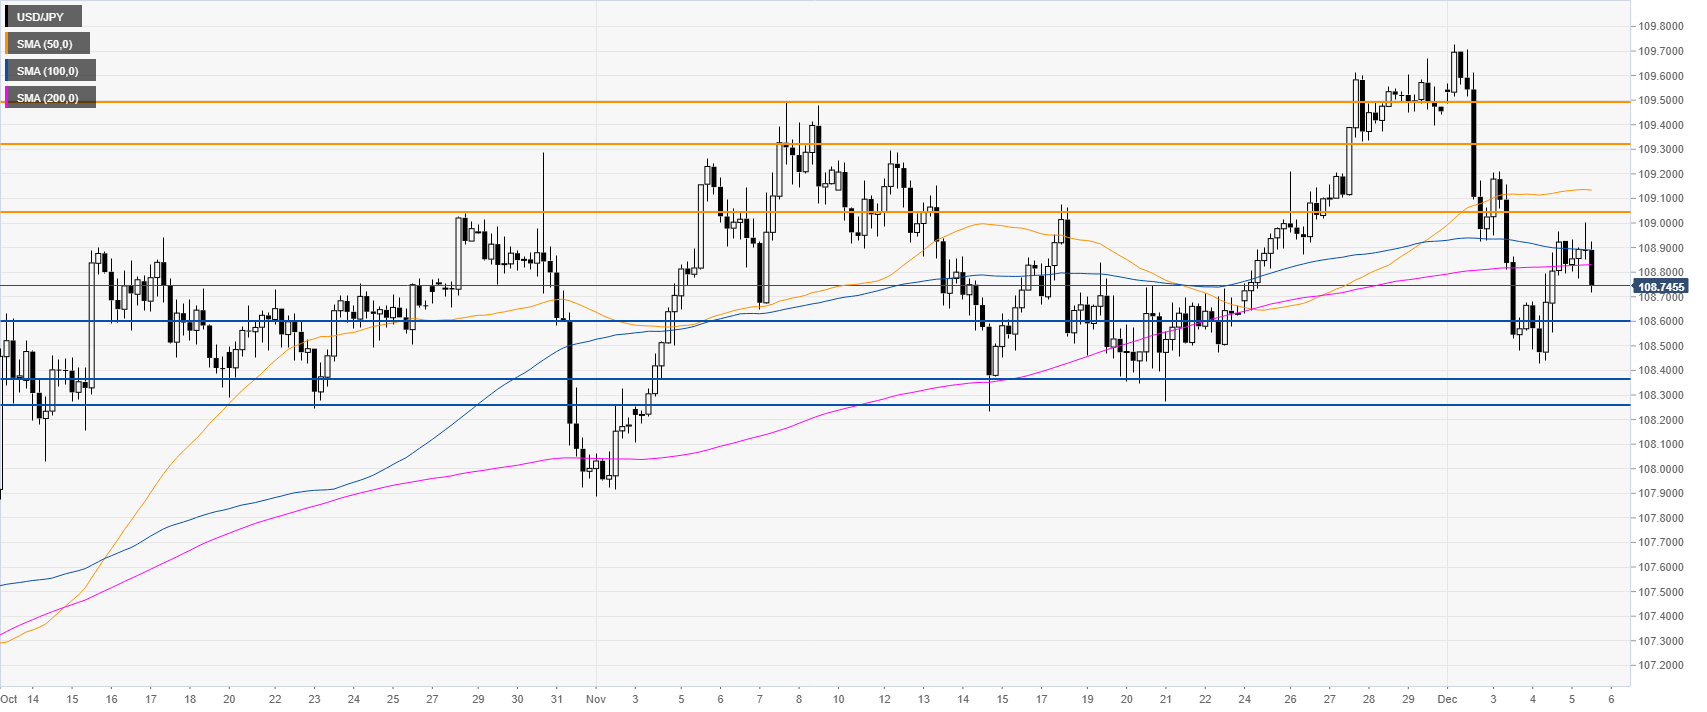
USD/JPY four-hour chart
USD/JPY remains on the back foot below the 109.04 resistance and the main SMAs. Bears will likely try retest 108.59 support. If this level fails to hold prices, the spot could decline towards the 108.36/25 level, according to the Technical Confluences Indicator.
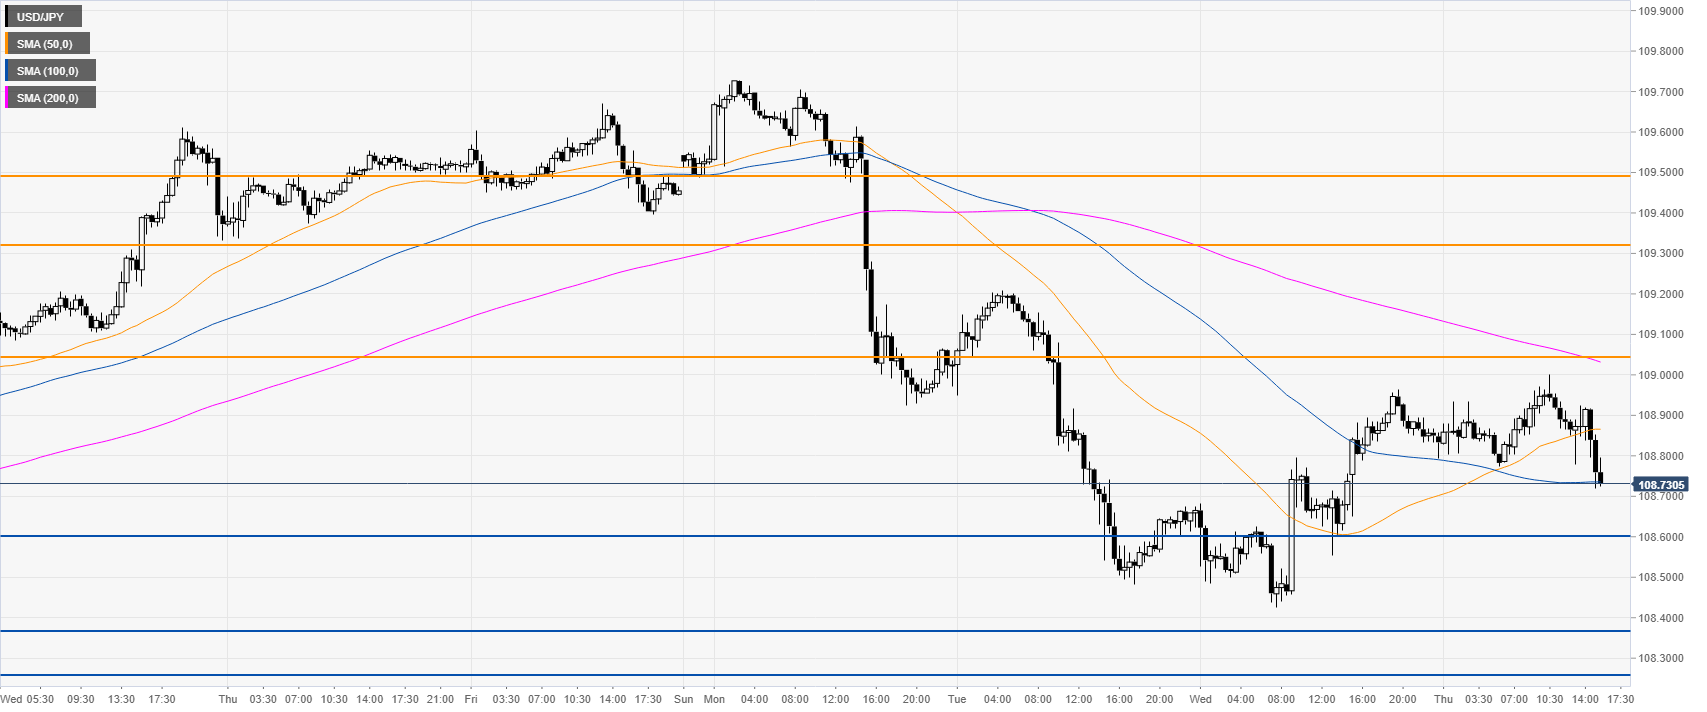
USD/JPY 30-minute chart
USD/JPY is trading below a downward sloping 200 SMA on the 30-minute chart suggesting a bearish bias in the near term. Resistance is seen at 109.04 and 109.49 price levels, according to the Technical Confluences Indicator.
Additional key levels
Author

Flavio Tosti
Independent Analyst
More from Flavio Tosti


