|
USD/JPY price analysis: Greenback enters Asia below 108.73 level against yen
- USD/JPY is trading near the December lows below its 200 DMA.
- Support is seen at the 108.45 and 108.11 levels.

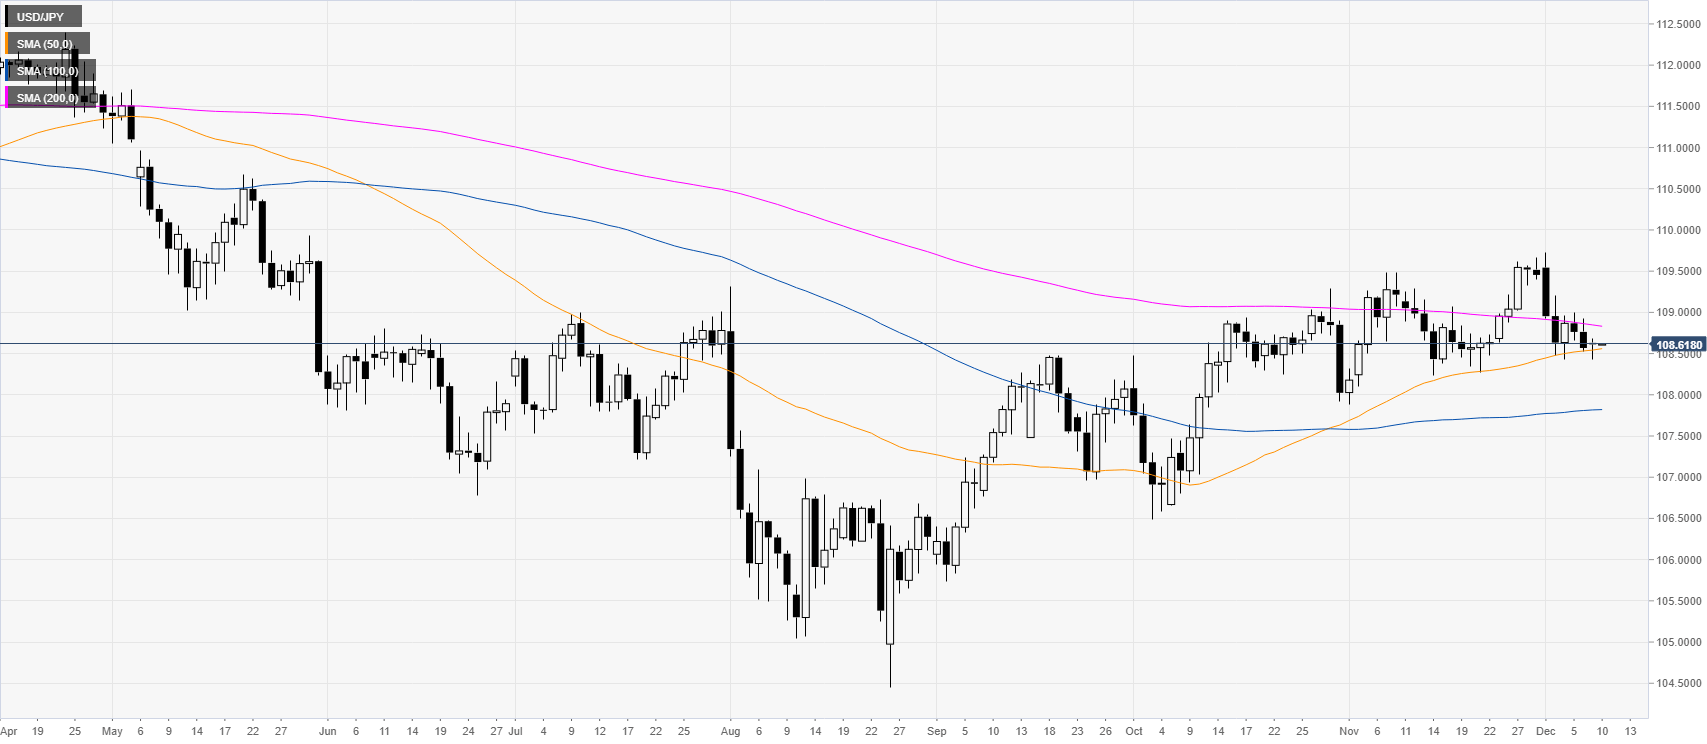
USD/JPY daily chart
USD/JPY is trading near the December lows above the 108.50 level and the 50-day simple moving average (DMA). However, the spot is trading below the 200 DMA, which can be a sign of weakness.
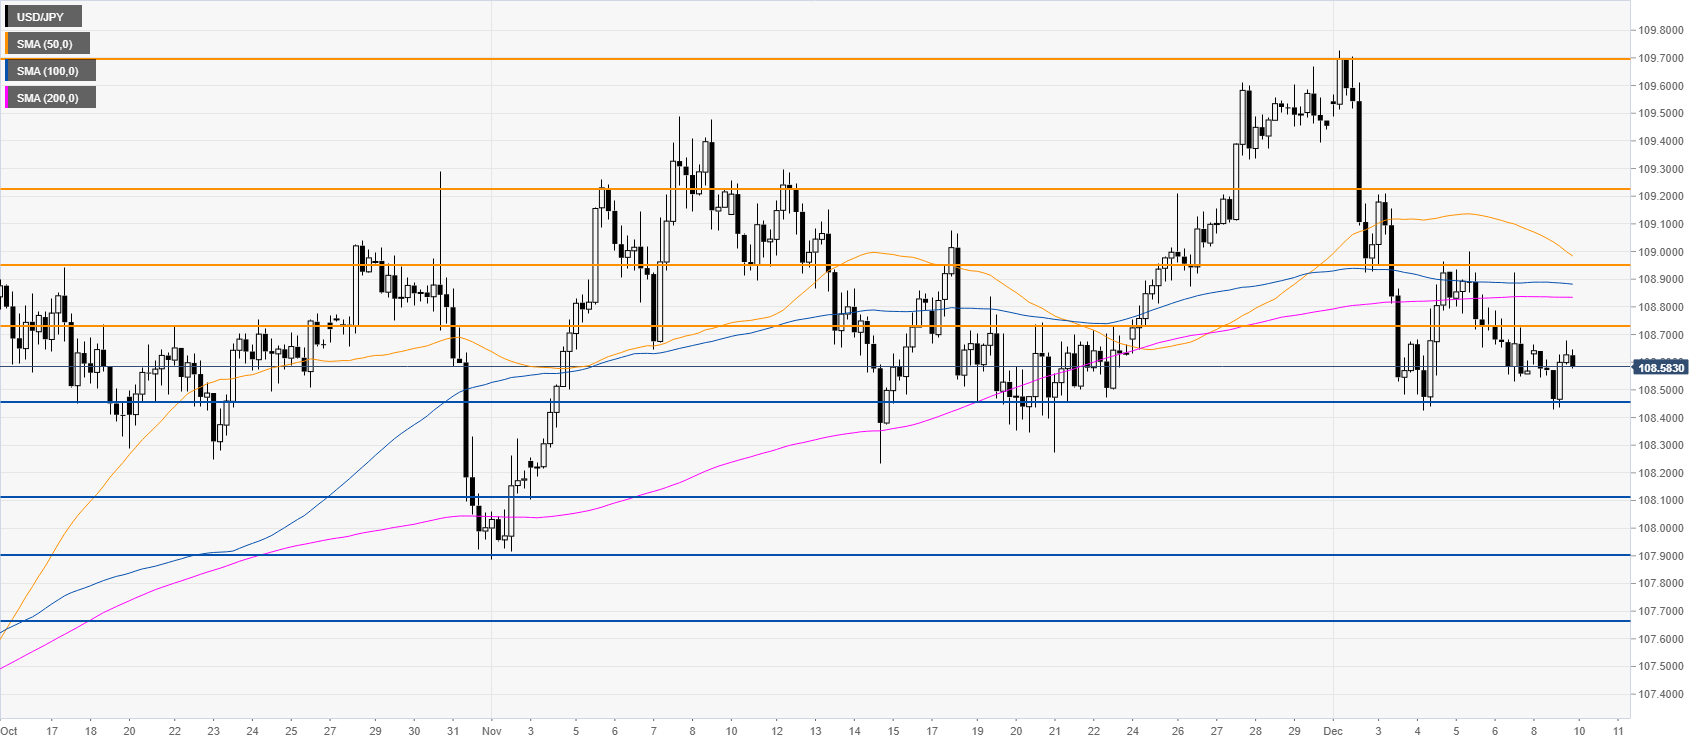
USD/JPY four-hour chart
The market is consolidating the early December drop while below the main SMAs. A daily close below the 108.45 support can see the market decline towards the 108.11, 107.90 and 107.66 price levels.
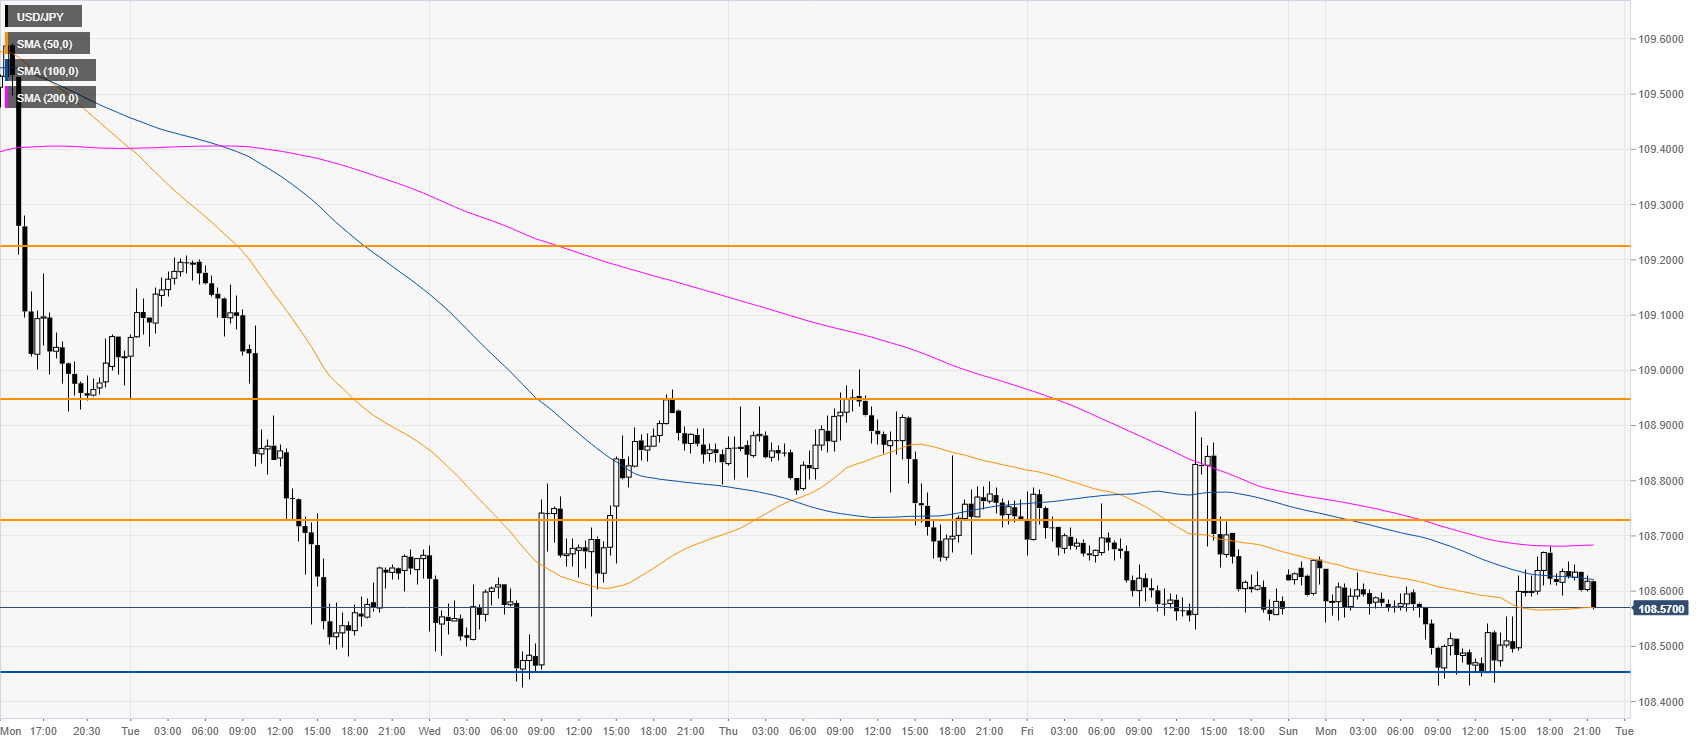
USD/JPY 30-minute chart
The market is trading below downward sloping 100/200 SMA, suggesting a bearish bias in the near term. Resistances are seen near 108.73, 108.95, 109.24 and 109.69 price levels, according to the Technical Confluences Indicator.
Additional key levels
Author

Flavio Tosti
Independent Analyst
More from Flavio Tosti


