|

USD/JPY Price Analysis: Gains momentum on rising US Treasury bond yields

  • USD/JPY reached fresh five-week highs at 134.57, with bulls eyeing 135.00.
  • Oscillators at bullish areas favor further upside in the USD/JPY.
  • Downside risks lie below 134.00, which could drive the USD/JPY towards 133.00.

The USD/JPY moved higher as US Treasury bond yields resumed their uptrend, following the last week’s hawkish commentary by Federal Reserve (Fed) officials. Fed Board Governor Christopher Waller’s comments that more tightening is needed, triggered the latest jump in the 10-year US T-bond yield. Therefore, the USD/JPY rallied and is trading at 134.47, up 0.52%.

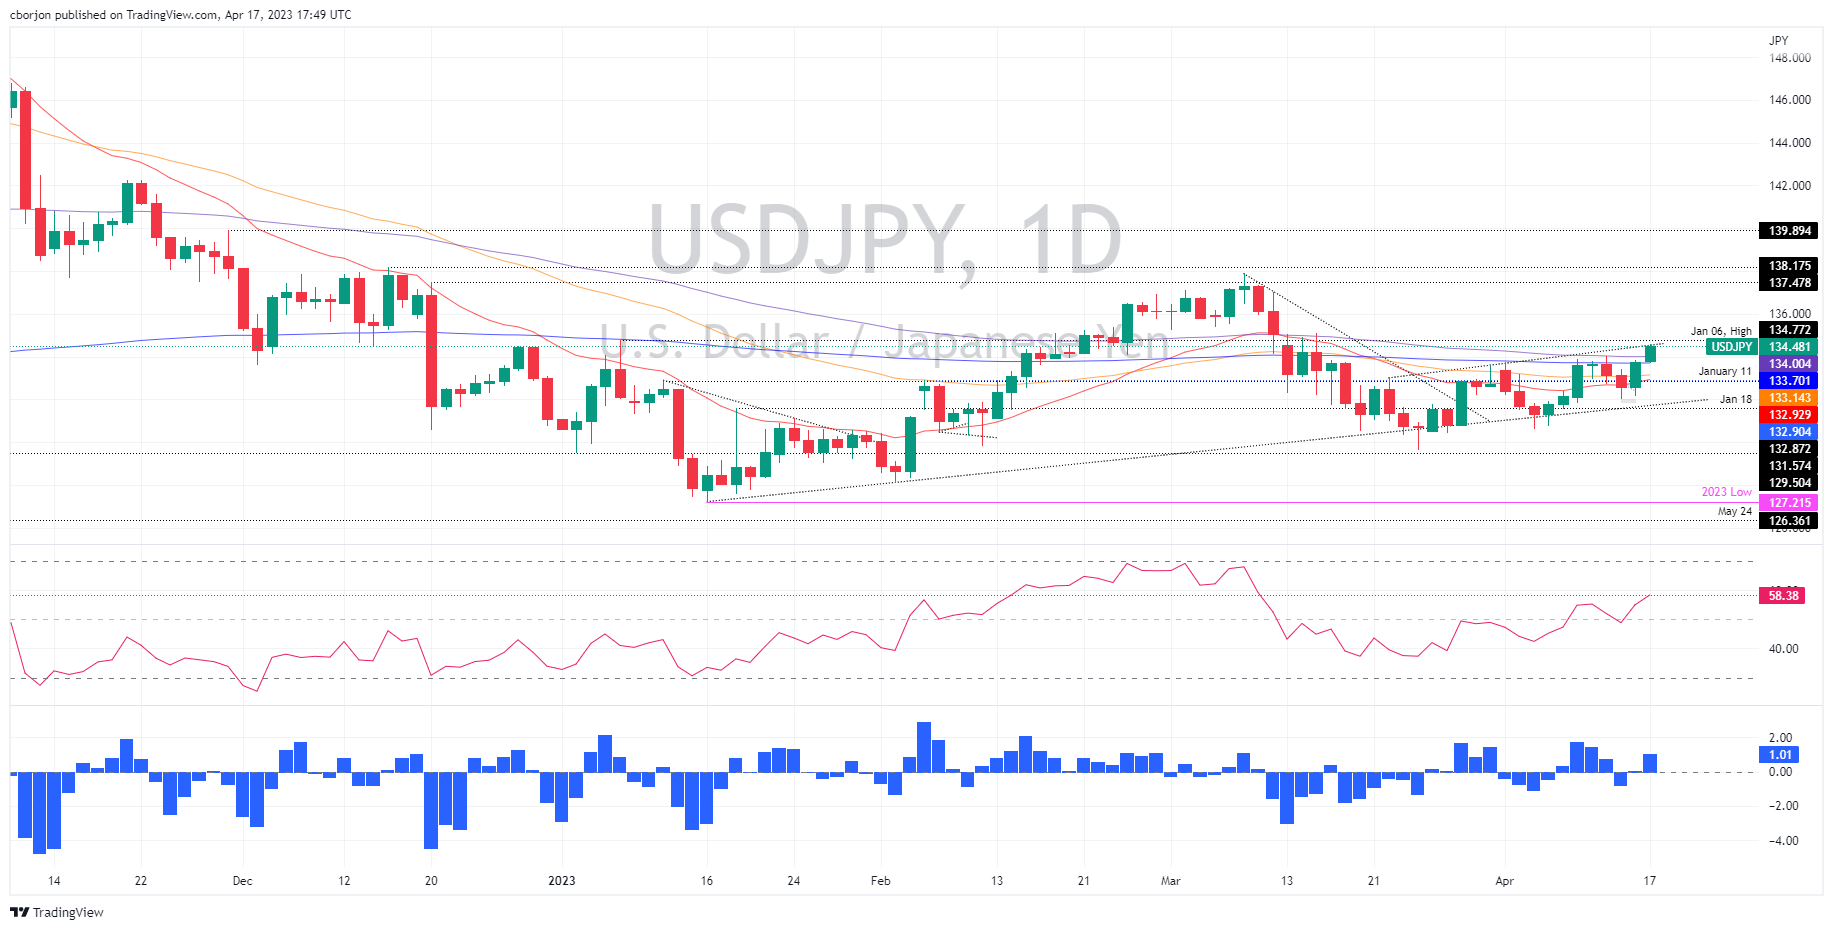
USD/JPY Price Action

The USD/JPY extended its gains past the last week’s high of 134.04, and it’s aiming to challenge a break above January 6 high at 134.77. On its way up, the USD/JPY climbed above several solid resistance areas, like the 200-day Exponential Moving Average (EMA) EMA at 133.70, followed by the 100-day Exponential Moving Average (EMA) at 134.00. Once the pair cleared those levels, a challenge to 135.00 is on the cards.

The Relative Strength Index (RSI) cements the upward case in bullish territory, while the Rate of Change (RoC) indicates that buying pressure is increasing.

If USD/JPY rallies above 135.00, the next resistance would be 136.00, followed by the psychological 137.00 level before testing the YTD high at 137.91. Conversely, if the USD/JPY retraces, the first support would be 100-day EMA at 134.00. A breach of the latter will immediately expose the 200-day EMA at 133.70, followed by the 50-day EMA At 133.14, before sliding to 133.00.

USD/JPY Daily Chart

USD/JPHY Daily Chart

USD/JPY Technical Levels

USD/JPY

Overview
Today last price134.46
Today Daily Change0.69
Today Daily Change %0.52
Today daily open133.77
 
Trends
Daily SMA20132.19
Daily SMA50133.47
Daily SMA100133.14
Daily SMA200137.16
 
Levels
Previous Daily High133.84
Previous Daily Low132.17
Previous Weekly High134.04
Previous Weekly Low131.83
Previous Monthly High137.91
Previous Monthly Low129.64
Daily Fibonacci 38.2%133.2
Daily Fibonacci 61.8%132.81
Daily Pivot Point S1132.68
Daily Pivot Point S2131.59
Daily Pivot Point S3131.01
Daily Pivot Point R1134.35
Daily Pivot Point R2134.93
Daily Pivot Point R3136.02

Author

Christian Borjon Valencia

Christian Borjon began his career as a retail trader in 2010, mainly focused on technical analysis and strategies around it. He started as a swing trader, as he used to work in another industry unrelated to the financial markets.

More from Christian Borjon Valencia
Share:

Markets move fast. We move first.

Orange Juice Newsletter brings you expert driven insights - not headlines. Every day on your inbox.

By subscribing you agree to our Terms and conditions.

Editor's Picks

EUR/USD holds steady above 1.1750 as traders await FOMC Minutes

The EUR/USD pair holds steady near 1.1770 during the early Asian session on Tuesday. Traders continue to price in the prospect of further rate cuts by the US Federal Reserve in 2026, following the 25-basis-point rate reduction delivered at the December meeting. The release of the Federal Open Market Committee Minutes will be in the spotlight later on Tuesday.

GBP/USD finds key support near 1.35 despite year-end grind

GBP/USD remains bolstered on the high end as markets grind through the last trading week of the year. Cable caught a bullish tilt to keep price action on the high side of the 1.3500 handle, though year-end holiday volumes are unlikely to see significant progress in either direction as 2025 draws to a close.

Gold rebounds to near $4,350 after Monday's 4+% correction

Gold is bouncing to near $4,350 early Tuesday, helped by renewed US Dollar weakness and a dismal mood. Gold was hit sharply by profit-taking on Monday during US trading hours and retreated towards $4,300, where buyers reappeared.

Crypto market outlook for 2026

Year 2025 was volatile, as crypto often is.  Among positive catalysts were favourable regulatory changes in the U.S., rise of Digital Asset Treasuries, adoption of AI and tokenization of Real-World-Assets.

Economic outlook 2026-2027 in advanced countries: Solidity test

After a year marked by global economic resilience and ending on a note of optimism, 2026 looks promising and could be a year of solid economic performance. In our baseline scenario, we expect most of the supportive factors at work in 2025 to continue to play a role in 2026.

Crypto market outlook for 2026

Year 2025 was volatile, as crypto often is.  Among positive catalysts were favourable regulatory changes in the U.S., rise of Digital Asset Treasuries (DAT), adoption of AI and tokenization of Real-World-Assets (RWA).