|

USD/JPY Price Analysis: Gains momentum above 135.00 on dovish BoJ minutes

  • USD/JPY is upward biased, with price action trading above weekly EMAs.
  • Bullish-engulfing candle pattern suggests further upside is expected.
  • A break above the 136.00 figure exposes last week’s swing high at 137.77.

The USD/JPY accelerated above the 135.00 figure after the pair bounced off its daily low of 134.64, on fundamental news turning the market sour and a dovish stance by the Bank of Japan (BoJ), according to the March minutes. At the time of writing, the USD/JPY is trading at 135.15, gaining 0.28%.

USD/JPY Price Action

From the weekly chart perspective, the USD/JPY is upward biased, with price action trading above its weekly EMAs. Although last week’s candlestick was bearish, downside risks lie below the 50-WMA at 132.90, followed by 129.65. Hence, if USD/JPY stays above the previously-mentioned support levels, its path of least resistance is upwards. Additionally, the Relative Strength Index (RSI) indicator just crossed the 50-neutral line to bullish territory, suggesting buyers are gathering momentum.

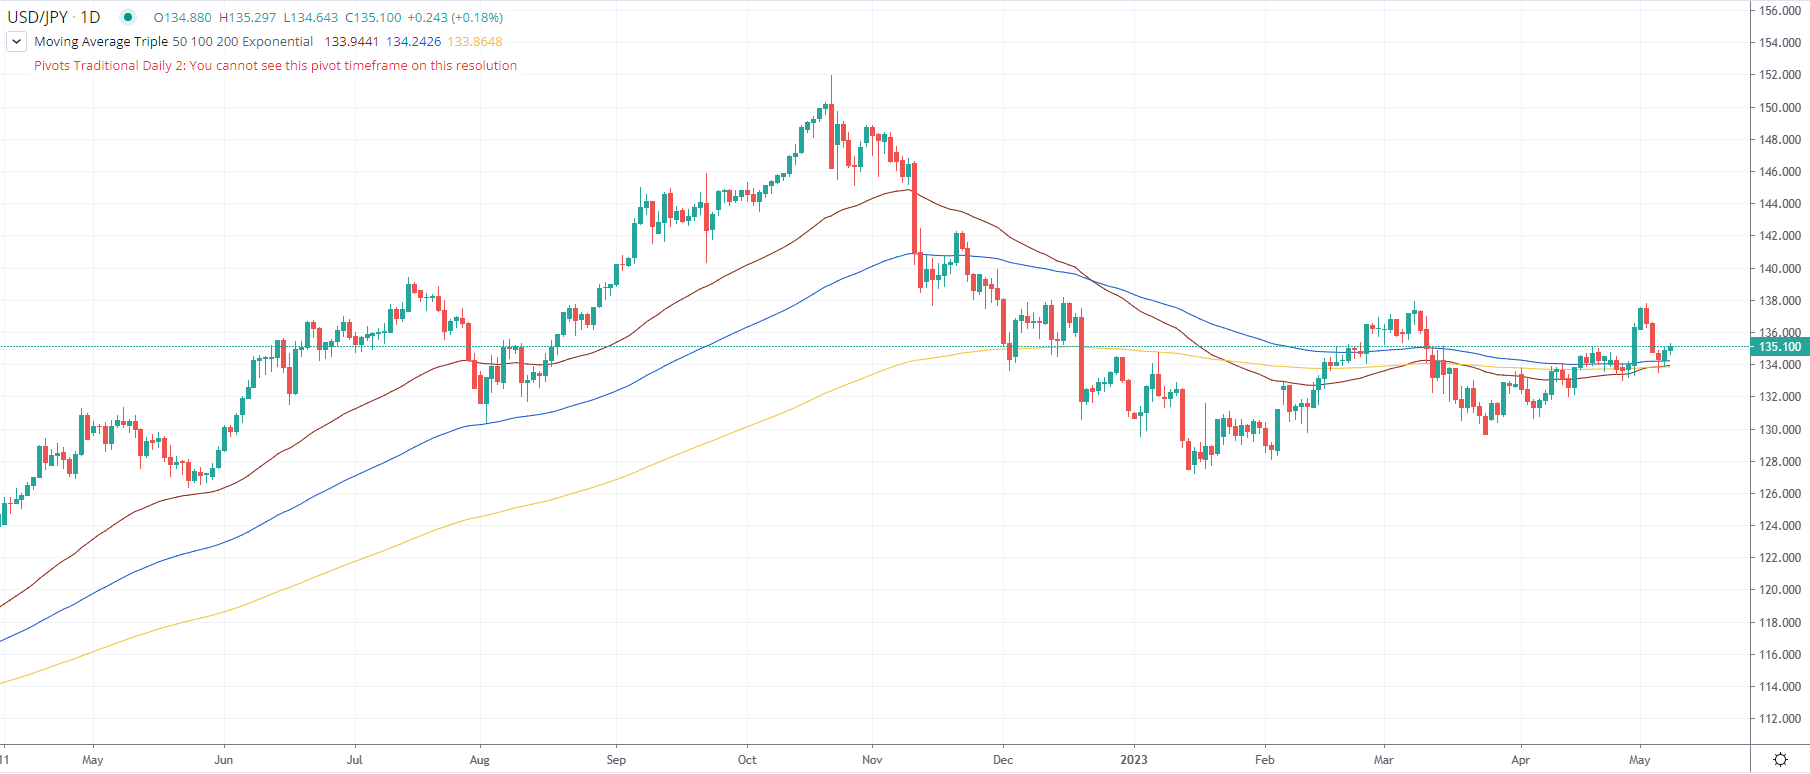
The USD/JPY, daily chart timeframe portrays the major trading sideways, as the EMAs remain flat. Nevertheless, the price action of May 4 and 5th formed a two-candlestick chart pattern known as a bullish-engulfing candle pattern, suggesting that further upside is expected.

If USD/JPY stays above 135.00, the first resistance would be the 136.00 figure. The break above will expose the May 3 daily high of 136.62, followed by the last week’s swing high at 137.77. Conversely, if USD/JPY drops below 135.00, that could open the door to testing the 100-day EMA at 134.20 before testing the confluence of the 50 and 200 EMA at 133.69/80.

USD/JPY Daily Chart

USD/JPY Daily chart

USD/JPY

Overview
Today last price135.12
Today Daily Change0.29
Today Daily Change %0.22
Today daily open134.83
 
Trends
Daily SMA20134.41
Daily SMA50133.88
Daily SMA100132.84
Daily SMA200136.99
 
Levels
Previous Daily High135.12
Previous Daily Low133.88
Previous Weekly High137.78
Previous Weekly Low133.5
Previous Monthly High136.56
Previous Monthly Low130.63
Daily Fibonacci 38.2%134.65
Daily Fibonacci 61.8%134.36
Daily Pivot Point S1134.1
Daily Pivot Point S2133.37
Daily Pivot Point S3132.86
Daily Pivot Point R1135.34
Daily Pivot Point R2135.85
Daily Pivot Point R3136.58

Author

Christian Borjon Valencia

Christian Borjon began his career as a retail trader in 2010, mainly focused on technical analysis and strategies around it. He started as a swing trader, as he used to work in another industry unrelated to the financial markets.

More from Christian Borjon Valencia
Share:

Markets move fast. We move first.

Orange Juice Newsletter brings you expert driven insights - not headlines. Every day on your inbox.

By subscribing you agree to our Terms and conditions.

Editor's Picks

EUR/USD steadies near 1.1750 ahead of final Eurozone CPI amid fading USD recovery

The EUR/USD pair steadies around the 1.1750 area during the Asian session on Wednesday, and for now, seems to have stalled the previous day's sharp retracement slide from the highest level since September 24. Meanwhile, the fundamental backdrop remains tilted in favor of bullish traders and suggests that the path of least resistance for spot prices remains to the upside.

GBP/USD gains ground above 1.3400 on UK PMI optimism

The GBP/USD pair gains momentum to around 1.3425 during the early Asian session on Wednesday. The Pound Sterling edges higher against the Greenback on the upbeat UK preliminary S&P Global Purchasing Managers' Index data. Traders will take more cues from the Fedspeak later on Wednesday. 

Gold advances to near seven-week highs amid US labor market cooling

Gold price extends its upside to near seven-week highs above $4,300 during the Asian trading hours on Wednesday. The precious metal gains momentum as the US labor market remains relatively resilient but shows signs of slowing. The mixed US employment report for November reinforces bets of further rate cuts by the US Federal Reserve and weighs on the US Dollar.

XRP dips as bearish pressure persists despite ETF growth

Ripple is finding footing above $1.90 at the time of writing on Tuesday after a bearish wave swept across the broader cryptocurrency market, building on persistent negative sentiment.

Ukraine-Russia in the spotlight once again

Since the start of the week, gold’s price has moved lower, but has yet to erase the gains made last week. In today’s report we intend to focus on the newest round of peace talks between Russia and Ukraine, whilst noting the release of the US Employment data later on day and end our report with an update in regards to the tensions brewing in Venezuela.

BNB Price Forecast: BNB slips below $855 as bearish on-chain signals and momentum indicators turn negative

BNB, formerly known as Binance Coin, continues to trade down around $855 at the time of writing on Tuesday, after a slight decline the previous day. Bearish sentiment further strengthens as BNB’s on-chain and derivatives data show rising retail activity.