|

USD/JPY Price Analysis: Fluctuates ahead of the 145.00 figure as another FX intervention looms

  • The USD/JPY oscillates around Tuesday’s open, above the 144.70 mark.
  • The major remains upward biased but approaching the 20-day EMA, which, once cleared, could pave the way for further downside.
  • Short term, the USD/JPY is downward biased, as a double-top emerged in the 1-hour chart.

The USD/JPY fluctuates around the week’s high 144.78, amidst a risk-on impulse, as portrayed by US equities sustaining decent gains following the sell-off of the last couple of trading sessions, courtesy of an upbeat sentiment. At the time of writing, the USD/JPY is trading at 144.80, almost flat.

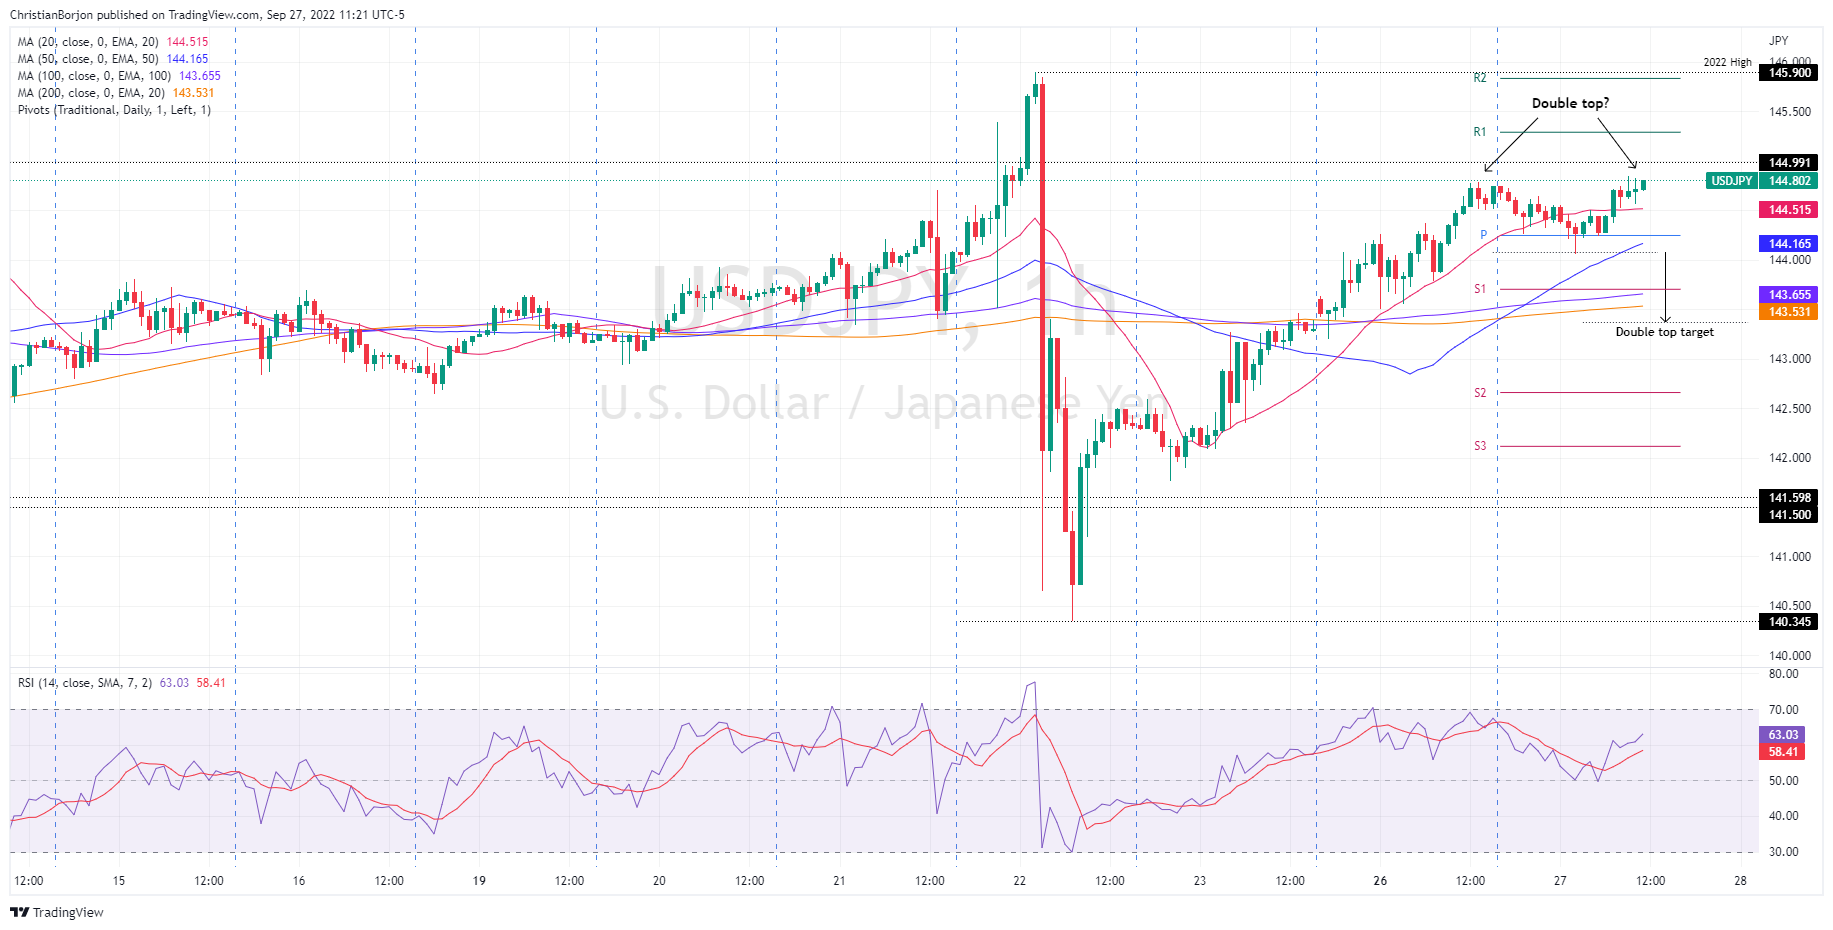
USD/JPY Price Analysis: Technical outlook

The USD/JPY is range-bound in the 142.00-145.00 range following last week’s intervention. Even though the major remains upward biased, and the 20-day EMA is closing to price action, which means that a break below the latter would exert downward pressure on the pair in the near term.

Short term, the USD/JPY one-hour chart shows that a double-top chart pattern is emerging at around the 144.60-75 area, which could pave the way for further losses. Nevertheless, the 20 and the 50-EMAs, meandering around 144.51 and 144.16, respectively, would be difficult to surpass. But once cleared, a fall towards the S1 daily pivot at around 143.70 is on the cards.

On the flip side, the USD/JPY’s first resistance would be the 145.00 figure, the line in the sand imposed by the Bank of Japan, last week’s intervention. Break above will expose the YTD high at 145.90, ahead of the 146.00 figure.

USD/JPY Key Technical Levels

USD/JPY

Overview
Today last price144.80
Today Daily Change0.02
Today Daily Change %0.01
Today daily open144.76
 
Trends
Daily SMA20142.51
Daily SMA50138.27
Daily SMA100135.6
Daily SMA200127.36
 
Levels
Previous Daily High144.79
Previous Daily Low143.25
Previous Weekly High145.9
Previous Weekly Low140.35
Previous Monthly High139.08
Previous Monthly Low130.4
Daily Fibonacci 38.2%144.2
Daily Fibonacci 61.8%143.84
Daily Pivot Point S1143.74
Daily Pivot Point S2142.73
Daily Pivot Point S3142.21
Daily Pivot Point R1145.28
Daily Pivot Point R2145.8
Daily Pivot Point R3146.82

Author

Christian Borjon Valencia

Christian Borjon began his career as a retail trader in 2010, mainly focused on technical analysis and strategies around it. He started as a swing trader, as he used to work in another industry unrelated to the financial markets.

More from Christian Borjon Valencia
Share:

Markets move fast. We move first.

Orange Juice Newsletter brings you expert driven insights - not headlines. Every day on your inbox.

By subscribing you agree to our Terms and conditions.

Editor's Picks

EUR/USD bears await break below 100-day SMA support near 1.1665 area

The EUR/USD pair attracts heavy selling for the second straight day and dives to a nearly four-week trough, around the 1.1670 region, during the Asian session on Monday. Bearish traders now await a sustained break below the 100-day Simple Moving Average before positioning for an extension of the recent pullback from a three-month top, or levels just above the 1.1800 mark touched on December 24.

GBP/USD falls toward 1.3400 near 50-day EMA

GBP/USD extends its losses for the second successive session, trading around 1.3420 during the Asian hours on Monday. The technical analysis of the daily chart indicates that the 14-day Relative Strength Index at 53 has eased from near overbought, indicating that momentum has cooled while remaining above the midline. RSI holds above 50, keeping a modest bullish bias.

Gold on fire at the start of the week on US-Venezuela tensions

Gold regains upside traction early Monday as flight to safety prevails on Venezuela turmoil. The US Dollar finds strong haven demand, caps Gold’s upside as focus shifts to US jobs data. Gold’s daily technical setup suggests that more upside remains in the offing.

Bulls firmly in control as Bitcoin breaks $93K, Ethereum and Ripple extend gains

Bitcoin, Ethereum, and Ripple extended their rallies on Monday, gaining more than 4%, 6%, and 12%, respectively, in the previous week. The top three cryptocurrencies by market capitalization could continue to outperform, with bulls in control of the momentum.

Economic outlook 2026-2027 in advanced countries: Solidity test

After a year marked by global economic resilience and ending on a note of optimism, 2026 looks promising and could be a year of solid economic performance. In our baseline scenario, we expect most of the supportive factors at work in 2025 to continue to play a role in 2026.

Meme Coins Price Prediction: Dogecoin, Shiba Inu, Pepe rally on Venezuela’s shadow BTC reserve

Meme coins such as Dogecoin, Shiba Inu, and Pepe are leading the cryptocurrency market rally driven by the US cross-border operation to capture Venezuelan President Nicolás Maduro. Dogecoin extends its gain for the fifth consecutive day while SHIB and PEPE take a pause.