|

USD/JPY Price Analysis: Flat-lines near 146.40 ahead of US economic data

  • USD/JPY holds above the 50- and 100-hour EMAs with an upward slope.
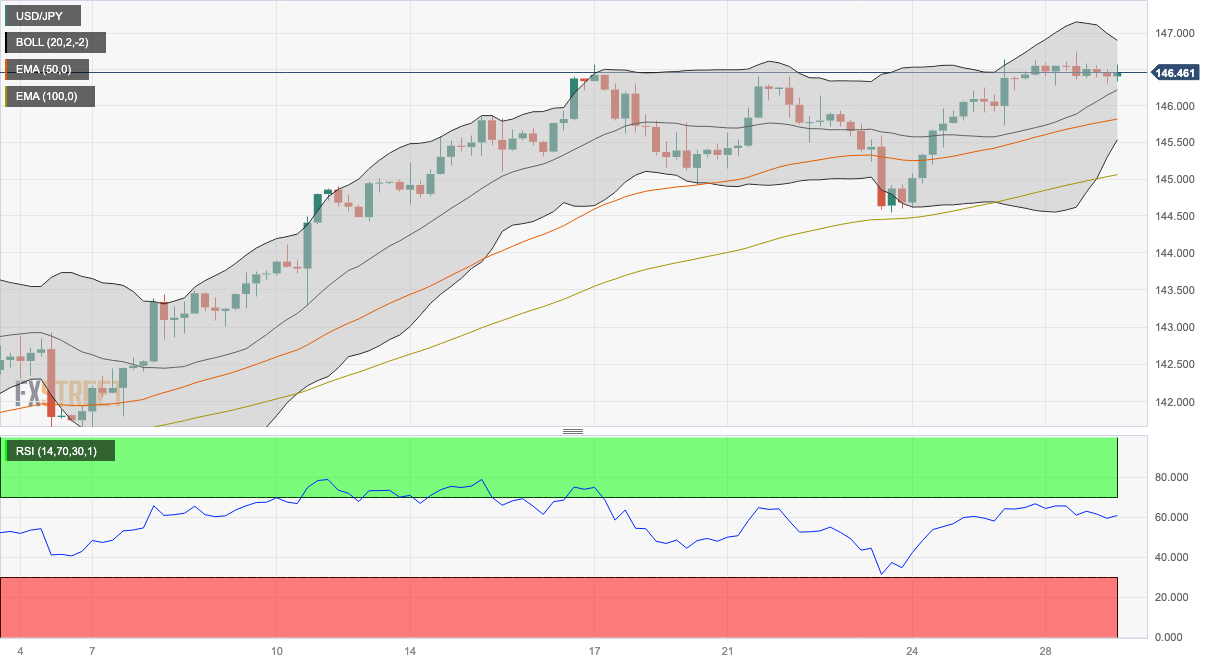
  • A Year-To-Date (YTD) high of 146.75 will be the first resistance level for the pair.
  • The initial contention for USD/JPY is located at 145.80.

The USD/JPY pair oscillates in a narrow range near 146.42 during the early European trading hours on Tuesday. Market participants prefer to wait on the sidelines ahead of the release of US CB Consumer Confidence and JOLTS Job Openings for July due later in the North American session.

Apart from this, the Japanese Unemployment Rate increased to 2.7% in July from 2.5% in June, according to the latest figures from the Statistics Bureau. The figure rose for the first time in four months and exerted pressure on the Bank of Japan (BoJ) and the government. However, traders turn cautious to place buying bets amid the fear of FX intervention by the BoJ.

Technically, the USD/JPY pair stands above the 50- and 100-hour Exponential Moving Averages (EMAs) with an upward slope, which means the path of least resistance is to the upside for the major pair.

The immediate resistance level for USD/JPY appears at a Year-To-Date (YTD) high of 146.75. Any meaningful follow-through buying will see a rally to the boundary of the Bollinger Band and a psychological round mark at the 146.90-147.00 region. Further north, the next barrier to watch for USD/JPY is located at 147.55 (a high of November 2022), followed by 148.00 (a round figure).

On the downside, the initial contention for the major pair is located at 145.80 (50-hour EMA). The next contention level emerges near a lower limit of the Bollinger Band at 145.55. Any intraday pullback below the latter would expose the next downside stop at 145.05 (100-hour EMA), and finally at 144.55 (a low of August 23).

It’s worth noting that the Relative Strength Index (RSI) stands in bullish territory above 50, which indicates that the upside momentum has been activated for the time being.
 

USD/JPY four-hour chart

USD/JPY

Overview
Today last price146.41
Today Daily Change-0.13
Today Daily Change %-0.09
Today daily open146.54
 
Trends
Daily SMA20144.74
Daily SMA50142.96
Daily SMA100140.01
Daily SMA200136.7
 
Levels
Previous Daily High146.75
Previous Daily Low146.27
Previous Weekly High146.64
Previous Weekly Low144.54
Previous Monthly High144.91
Previous Monthly Low137.24
Daily Fibonacci 38.2%146.57
Daily Fibonacci 61.8%146.45
Daily Pivot Point S1146.29
Daily Pivot Point S2146.05
Daily Pivot Point S3145.82
Daily Pivot Point R1146.76
Daily Pivot Point R2146.99
Daily Pivot Point R3147.24

Author

Lallalit Srijandorn

Lallalit Srijandorn is a Parisian at heart. She has lived in France since 2019 and now becomes a digital entrepreneur based in Paris and Bangkok.

More from Lallalit Srijandorn
Share:

Markets move fast. We move first.

Orange Juice Newsletter brings you expert driven insights - not headlines. Every day on your inbox.

By subscribing you agree to our Terms and conditions.

Editor's Picks

EUR/USD bounces toward 1.1750 as US Dollar loses strength

EUR/USD returned to the 1.1750 price zone in the American session on Friday, despite falling Wall Street, which indicates risk aversion. Trading conditions remain thin following the New Year holiday and ahead of the weekend, with the focus shifting to US employment and European data scheduled for next week.

GBP/USD nears 1.3500, holds within familiar levels

After testing 1.3400 on the last day of 2025, GBP/USD managed to stage a rebound. Nevertheless, the pair finds it difficult to gather momentum and trades with modest intraday gains at around 1.3490 as market participants remain in holiday mood.

Gold trims intraday gains, approaches $4,300

Gold retreated sharply from the $4,400  area and trades flat for the day in the $4,320 price zone. Choppy trading conditions exacerbated the intraday decline, although XAU/USD bearish case is out of the picture, considering growing expectations for a dovish Fed and persistent geopolitical tensions.

Cardano gains early New Year momentum, bulls target falling wedge breakout

Cardano kicks off the New Year on a positive note and is extending gains, trading above $0.36 at the time of writing on Friday. Improving on-chain and derivatives data point to growing bullish interest, while the technical outlook keeps an upside breakout in focus.

Economic outlook 2026-2027 in advanced countries: Solidity test

After a year marked by global economic resilience and ending on a note of optimism, 2026 looks promising and could be a year of solid economic performance. In our baseline scenario, we expect most of the supportive factors at work in 2025 to continue to play a role in 2026.

Crypto market outlook for 2026

Year 2025 was volatile, as crypto often is.  Among positive catalysts were favourable regulatory changes in the U.S., rise of Digital Asset Treasuries (DAT), adoption of AI and tokenization of Real-World-Assets (RWA).