|

USD/JPY Price Analysis: Failure at 115.70 opens the door for a leg-down before resuming uptrend

  • The USD/JPY slides 0.15% as investors prepare for the weekend.
  • The greenback finished the week above 97.00 for the first time since June 2020.
  • USD/JPY is upward biased, but the pair could print a leg-down before resuming the uptrend. 

As Wall Street closes, the USD/JPY slides ahead of the weekend, spurred by the US 10-year Treasury yield fall, which drops eight basis points, from 1.85% to 1.777%. At the time of writing, the USD/JPY is trading at 115.22.

The New York session witnessed a slight improvement in the market mood as US stocks rebounded near the close of Wall Street, finishing with gains.

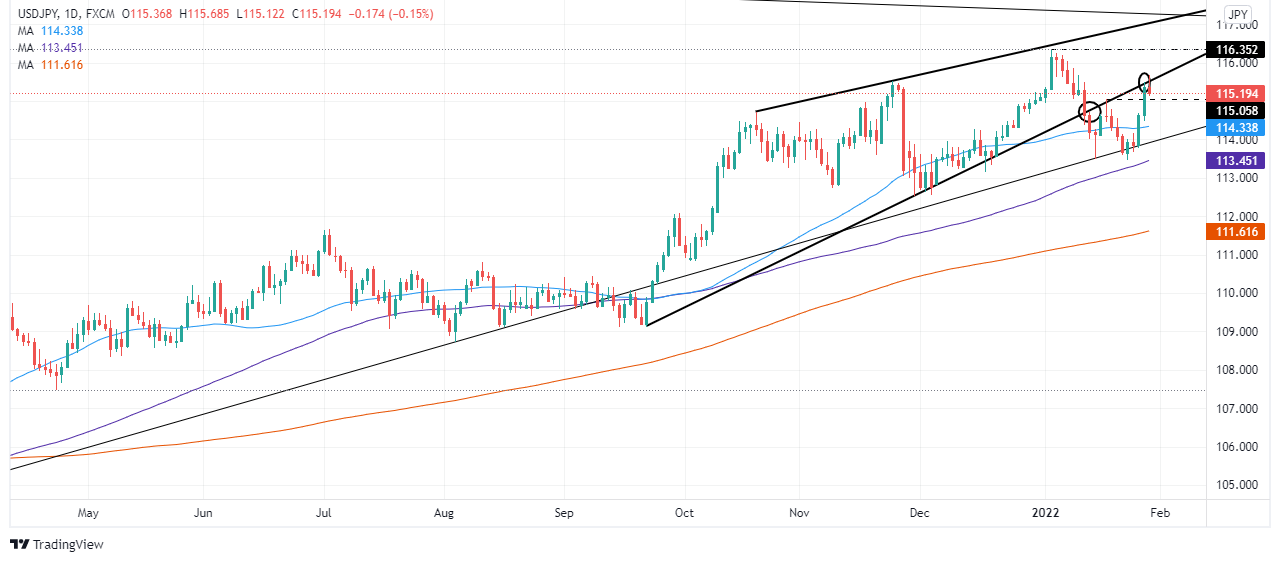
The USD has been on the defensive in the FX market, undermined by falling US T-bond yields versus the Japanese yen, failing to break above an upslope trendline, drawn from October 2021 lows to December ones passing around the 115.40-60 range.

On Friday, during the overnight session for North American traders, the USD/JPY peaked at around 115.68, above the abovementioned trendline. However, as American traders got to their desks, the pair fell 40-pips to current levels.

USD/JPY Price Forecast: Technical outlook

The USD/JPY is upward biased, as depicted by the daily chart. Failure to break above 115.70 might open the door for a leg-down before resuming the uptrend. However, as long as the retracement remains above the 50-day moving average (DMA) at 114.34, it would keep the uptrend intact.

The USD/JPY to the upside, the first resistance would be January 4, YTD high at 116.35. A breach of the latter would expose a downslope trendline drawn since August 1998 swing highs, a 24-year old trendline around 117.00-20, followed by a test of January 3, 2017, swing high at 118.61.

USD/JPY

Overview
Today last price115.24
Today Daily Change-0.12
Today Daily Change %-0.10
Today daily open115.36
 
Trends
Daily SMA20114.84
Daily SMA50114.33
Daily SMA100113.41
Daily SMA200111.6
 
Levels
Previous Daily High115.49
Previous Daily Low114.48
Previous Weekly High115.06
Previous Weekly Low113.6
Previous Monthly High115.21
Previous Monthly Low112.56
Daily Fibonacci 38.2%115.1
Daily Fibonacci 61.8%114.86
Daily Pivot Point S1114.72
Daily Pivot Point S2114.09
Daily Pivot Point S3113.71
Daily Pivot Point R1115.74
Daily Pivot Point R2116.12
Daily Pivot Point R3116.75

Author

Christian Borjon Valencia

Christian Borjon began his career as a retail trader in 2010, mainly focused on technical analysis and strategies around it. He started as a swing trader, as he used to work in another industry unrelated to the financial markets.

More from Christian Borjon Valencia
Share:

Markets move fast. We move first.

Orange Juice Newsletter brings you expert driven insights - not headlines. Every day on your inbox.

By subscribing you agree to our Terms and conditions.

Editor's Picks

EUR/USD eyes 1.1800 barrier near two-month highs

EUR/USD extends its gains for the second successive session, trading around 1.1780 during the Asian hours on Tuesday. On the daily chart, technical analysis indicates a persistent bullish bias, as the pair moves upward within the ascending channel pattern. Additionally, the 14-day Relative Strength Index at 68.89 sits near overbought, signaling strong demand. RSI remains elevated, which could cap gains if overbought conditions emerge.

GBP/USD knocks ten-week highs ahead of holiday slowdown

GBP/USD found room on the high side on Monday, kicking off a holiday-shortened trading week with a fresh spat of Greenback weakness, bolstering the Pound Sterling into its highest bids in ten weeks. Pound traders are largely brushing off the latest interest rate cut from the Bank of England as the UK’s central bank policy strategy leaves the water murky for rate-cut watchers.

Gold bulls seem unstoppable amid supportive fundamental backdrop

Gold is seen building on the previous day's strong rally of over 2% and continues scaling new all-time highs for the second consecutive day on Tuesday. The commodity climbs closer to the $4,500 psychological mark during the Asian session and remains well supported by a combination of factors. 

Uniswap holds above $6 as traders eye UNIfication vote outcome

Uniswap price holds above $6 at the time of writing on Tuesday after closing above a key resistance zone in the previous week. Traders are focusing on the highly anticipated UNIfication proposal, which is set to conclude on Thursday, and could become a key near-term catalyst. On the technical side, momentum indicators are flashing bullish signals, hinting at an upside rally.

Ten questions that matter going into 2026

2026 may be less about a neat “base case” and more about a regime shift—the market can reprice what matters most (growth, inflation, fiscal, geopolitics, concentration). The biggest trap is false comfort: the same trades can look defensive… right up until they become crowded.

XRP steadies above $1.90 support as fund inflows and retail demand rise

Ripple (XRP) is stable above support at $1.90 at the time of writing on Monday, after several attempts to break above the $2.00 hurdle failed to materialize last week. Meanwhile, institutional interest in the cross-border remittance token has remained steady.