|

USD/JPY Price Analysis: Erases previous-day losses and climbs above 156.00

  • USD/JPY climbs and gains 0.79%, supported by strong US economic data.
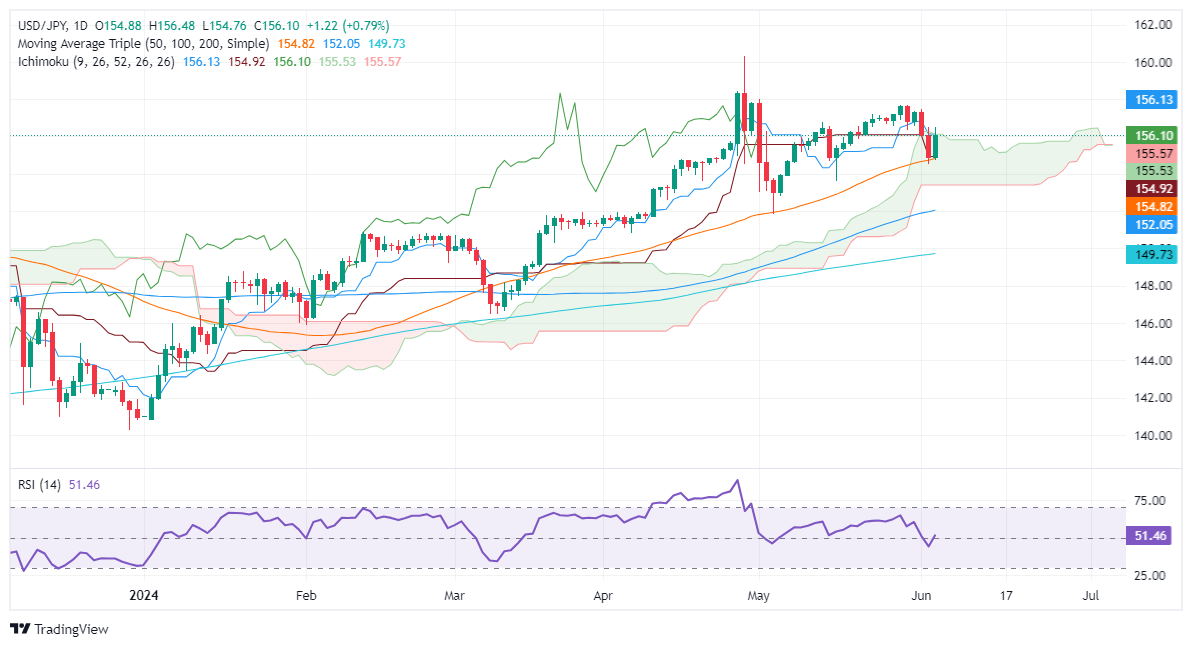
  • Technical outlook shows a bullish harami pattern, indicating potential for further gains.
  • Key resistance levels: 156.50, May 30 high at 157.68, and YTD high at 160.32; support at 156.00, 155.00, and confluence of Tenkan-Sen and 50-DMA at 154.81/92.

The USD/JPY recovered some ground and advanced towards the top of the Ichimoku Cloud (Kumo) on Wednesday, gaining some 0.79% and trading at 156.11 at the time of writing. Data from the United States kept the Greenback bid while falling Japanese Government Bond (JGB) yields undermined the Yen.

USD/JPY Price Analysis: Technical outlook

From a technical perspective, the USD/JPY remains upward biased despite retreating toward the 50-day moving average (DMA) at 154.82 on Tuesday. However, buyers lifted the exchange rate towards current levels, forming a ‘bullish harami’ candlestick chart pattern that could open the door for further gains.

Short-term momentum is on the buyers’ side, as depicted by the Relative Strength Index (RSI) standing in bullish territory.

The USD/JPY first resistance would be the 156.50 mark. A breach of the latte will expose the May 30 high of 157.68 before rallying toward the April 26 high of 158.44. Up next would be the year-to-date (YTD) high of 160.32.

On the flip side, the USD/JPY's first support would be 156.00. Once surpassed, the next stop would be 155.00, before testing the confluence of the Tenkan-Sen and the 50-DMA at around 154.81/92.

USD/JPY Price Action – Daily Chart

USD/JPY

Overview
Today last price156.08
Today Daily Change1.20
Today Daily Change %0.77
Today daily open154.88
 
Trends
Daily SMA20156.26
Daily SMA50154.73
Daily SMA100151.97
Daily SMA200149.68
 
Levels
Previous Daily High156.49
Previous Daily Low154.55
Previous Weekly High157.71
Previous Weekly Low156.37
Previous Monthly High157.99
Previous Monthly Low151.86
Daily Fibonacci 38.2%155.29
Daily Fibonacci 61.8%155.75
Daily Pivot Point S1154.12
Daily Pivot Point S2153.37
Daily Pivot Point S3152.18
Daily Pivot Point R1156.06
Daily Pivot Point R2157.24
Daily Pivot Point R3158

Author

Christian Borjon Valencia

Christian Borjon began his career as a retail trader in 2010, mainly focused on technical analysis and strategies around it. He started as a swing trader, as he used to work in another industry unrelated to the financial markets.

More from Christian Borjon Valencia
Share:

Markets move fast. We move first.

Orange Juice Newsletter brings you expert driven insights - not headlines. Every day on your inbox.

By subscribing you agree to our Terms and conditions.

Editor's Picks

EUR/USD moves sideways below 1.1800 on Christmas Eve

EUR/USD struggles to find direction and trades in a narrow channel below 1.1800 after posting gains for two consecutive days. Bond and stock markets in the US will open at the usual time and close early on Christmas Eve, allowing the trading action to remain subdued. 

GBP/USD keeps range around 1.3500 amid quiet markets

GBP/USD keeps its range trade intact at around 1.3500 on Wednesday. The Pound Sterling holds the upper hand over the US Dollar amid pre-Christmas light trading as traders move to the sidelines heading into the holiday season. 

Gold retreats from record highs, trades below $4,500

Gold retreats after setting a new record-high above $4,520 earlier in the day and trades in a tight range below $4,500 as trading volumes thin out ahead of the Christmas break. The US Dollar selling bias remains unabated on the back of dovish Fed expectations, which continues to act as a tailwind for the bullion amid persistent geopolitical risks.

Bitcoin slips below $87,000 as ETF outflows intensify, whale participation declines

Bitcoin price continues to trade around $86,770 on Wednesday, after failing to break above the $90,000 resistance. US-listed spot ETFs record an outflow of $188.64 million on Tuesday, marking the fourth consecutive day of withdrawals.

Economic outlook 2026-2027 in advanced countries: Solidity test

After a year marked by global economic resilience and ending on a note of optimism, 2026 looks promising and could be a year of solid economic performance. In our baseline scenario, we expect most of the supportive factors at work in 2025 to continue to play a role in 2026.

Avalanche struggles near $12 as Grayscale files updated form for ETF

Avalanche trades close to $12 by press time on Wednesday, extending the nearly 2% drop from the previous day. Grayscale filed an updated form to convert its Avalanche-focused Trust into an ETF with the US Securities and Exchange Commission.