|

USD/JPY Price Analysis: Dollar trades near session’s highs vs. yen, above 110.50 level

  • USD/JPY is consolidating the recent losses. 
  • The level to beat for bears is the 110.00 figure.
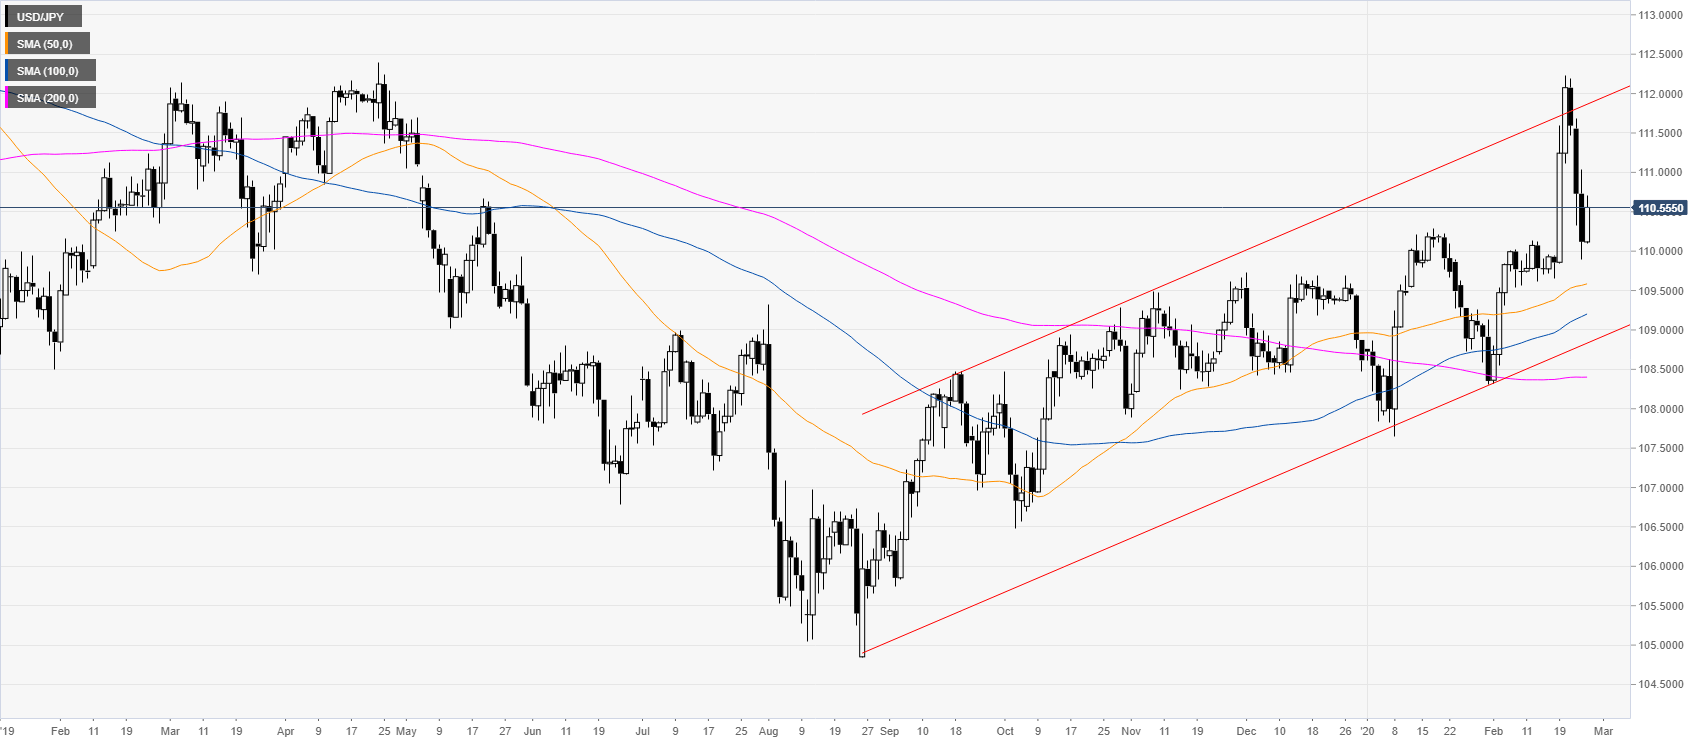
USD/JPY daily chart

 
USD/JPY is trading in a bull channel while above its main daily simple moving averages (SMAs). The spot is pulling back down after a huge breakout last week. 
 

USD/JPY four-hour chart

 
USD/JPY is trading in the 110.00/110.60 range while trading between the 50 and the 100 SMAs. As the market is consolidating the recent drop the bears might try to break below the 110.00 support to reach 109.40 and 108.60 on the way down. Resistances are seen near the 110.65 level and the 111.00 figure.
   
 
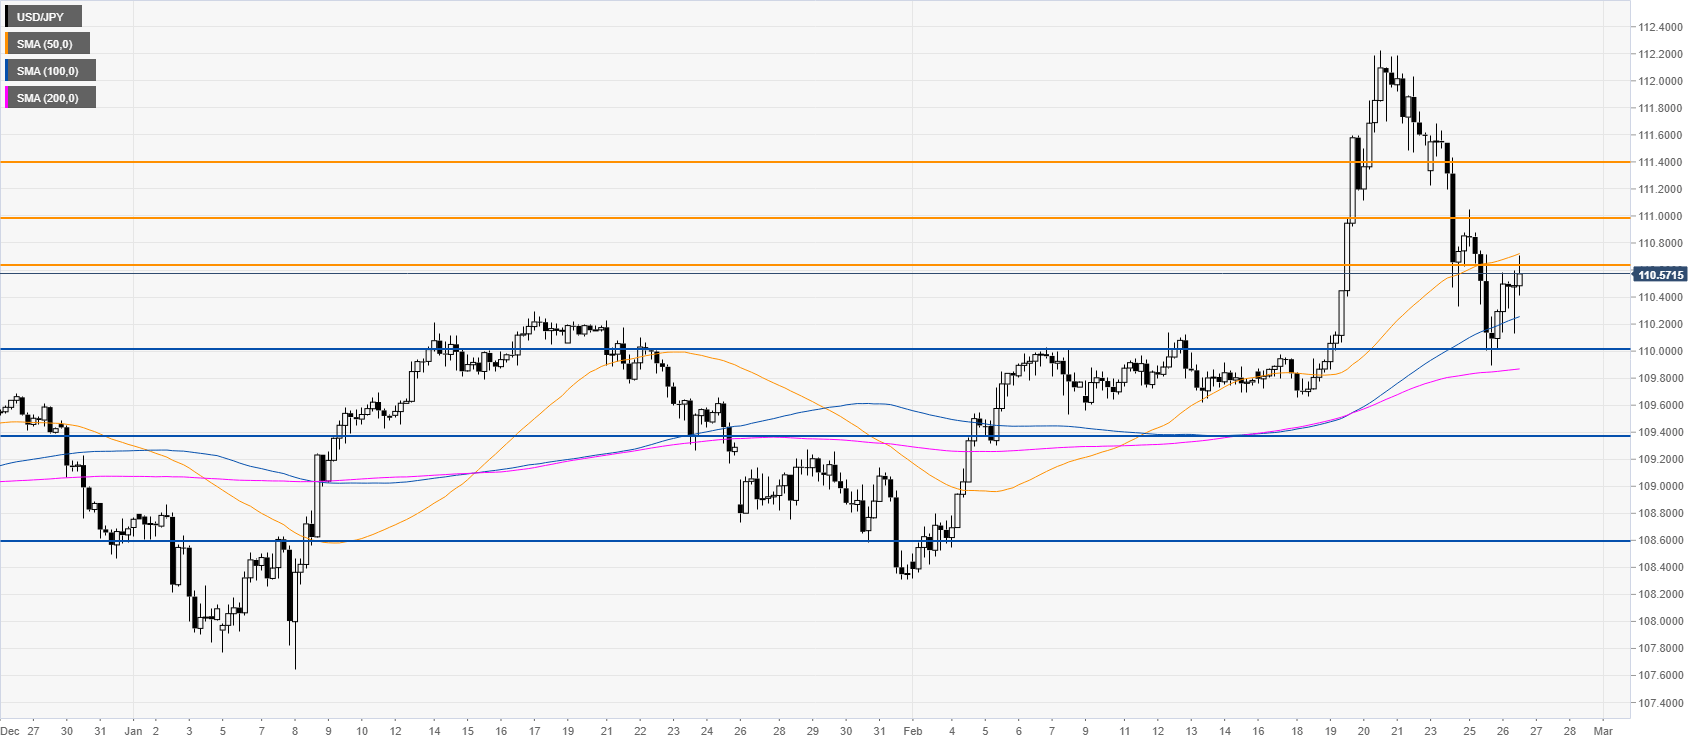
Resistance: 110.65, 111.00, 111.40
Support: 110.00, 109.40, 108.60


Additional key levels

USD/JPY

Overview
Today last price111.36
Today Daily Change1.24
Today Daily Change %1.13
Today daily open110.12
 
Trends
Daily SMA20109.94
Daily SMA50109.58
Daily SMA100109.18
Daily SMA200108.41
 
Levels
Previous Daily High111.04
Previous Daily Low109.89
Previous Weekly High112.23
Previous Weekly Low109.66
Previous Monthly High110.29
Previous Monthly Low107.65
Daily Fibonacci 38.2%110.33
Daily Fibonacci 61.8%110.6
Daily Pivot Point S1109.66
Daily Pivot Point S2109.2
Daily Pivot Point S3108.51
Daily Pivot Point R1110.81
Daily Pivot Point R2111.5
Daily Pivot Point R3111.96

Author

Flavio Tosti

Flavio Tosti

Independent Analyst


More from Flavio Tosti
Share:

Editor's Picks

EUR/USD looks to regain the 200-day SMA

EUR/USD regains some balance and trade just above 1.1600 the figure ahead of the opening bell in Asia. The pair initially dipped to the 1.1530 zone for the first time since November, always following the stronger US Dollar and the marked flight-to-safety in the context of the ongoing Middle East crisis
 

GBP/USD attacks 1.3300, refreshing three-month lows

GBP/USD is deep in the red near 1.3300, accelerating its downside to renew three-month lows in European trading on Tuesday. The ongoing escalation in the Iran war, combined with rising Oil prices, weighs negatively on the higher-yielding Pound Sterling as the US Dollar capitalizes on increased haven demand.

Gold bounces off lows, back above $5,100

Gold remains on the defensive, eroding part of the recent multi-day advance and managing to trade back above the $5,100 mark per troy ounce on Tuesday. The precious metal initially dropped just below the critical $5,000 threshold on the back of the persistent strength of the Greenback, higher US Treasury yields across the curve and investors' repricing of Fed rate cuts.

XRP risks extending losses as US-Iran war rages on

Ripple (XRP) has come under pressure, drifting lower to $1.35 at the time of writing on Tuesday. The over 2% correction looks poised to erase the previous day’s gains, which lifted the remittance token to $1.42.

Energy shock 2.0: Why rising Gas prices could hit the Euro

Even without a confirmed, sustained disruption, the mere risk to a key global energy chokepoint is enough to inject a significant premium into European Gas markets. And for the Euro, that matters.

Ripple falters amid sell-off jitters and negative funding rates

Ripple (XRP) has come under pressure, drifting lower to $1.35 at the time of writing on Tuesday. The over 2% correction looks poised to erase the previous day’s gains, which lifted the remittance token to $1.42.