|

USD/JPY Price Analysis: Dollar surges to 9-month high, breaks above 111.00 figure

  • After ten days of consolidation, USD/JPY broke strongly to the upside to fresh 2020 highs. 
  • The level to beat for bulls is the 111.50 resistance.
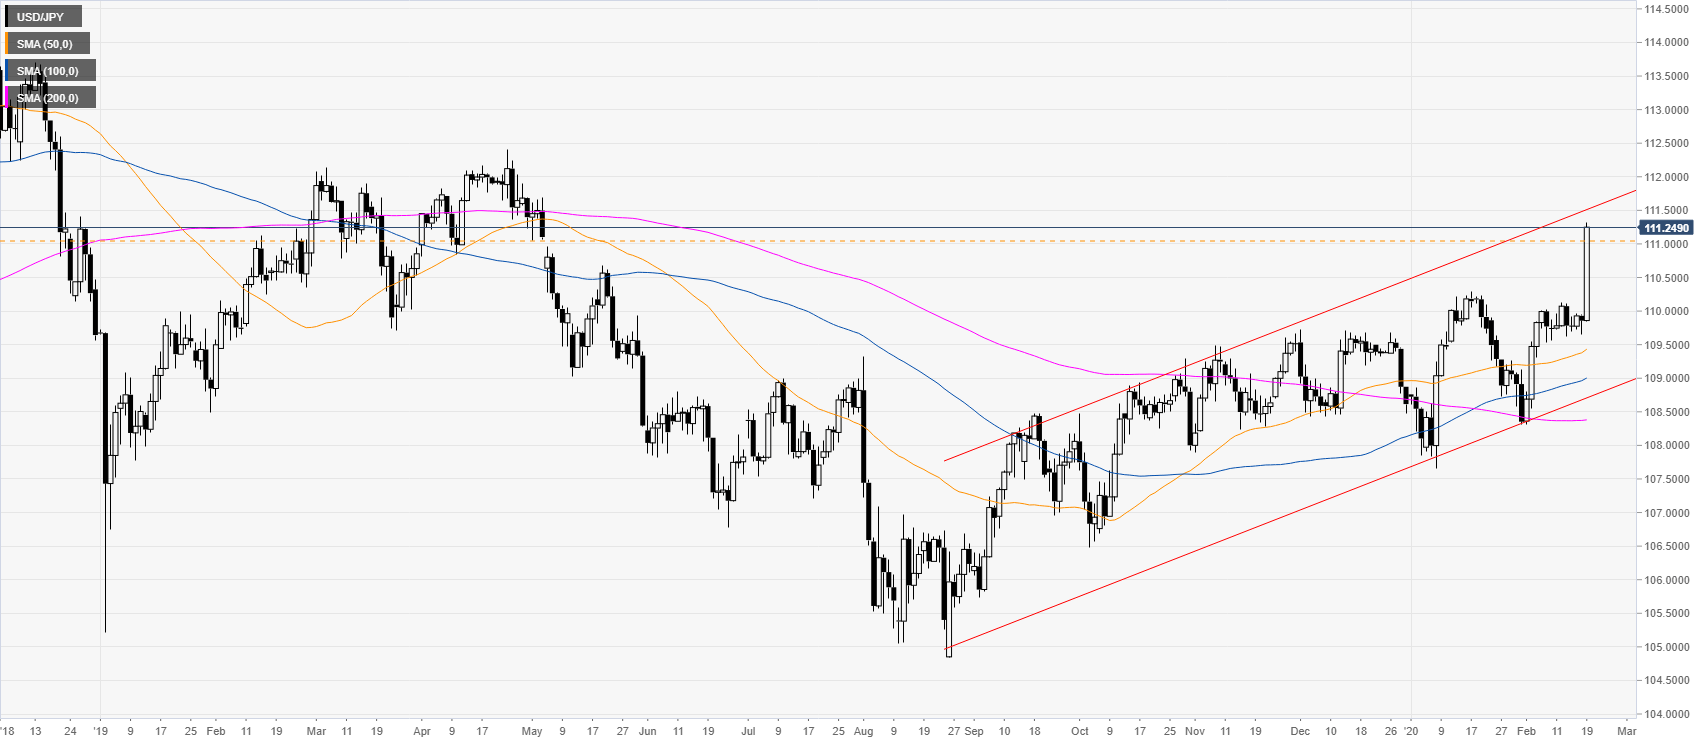
 

USD/JPY daily chart

 
USD/JPY is rising sharply breaking above the 111.00 figure and closing a gap from May 2019. The spot is trading in a bull channel while above its daily simple moving averages (SMAs). The market is having an exceptional intraday rally as the average daily range is about three times larger than usual.  
 

USD/JPY four-hour chart

 
USD/JPY is printing fresh 2020 highs as the market is spiking above its main SMAs. The market decided to break the range of the last ten days while breaking through several resistance levels, the better market mood and USD strength made bears capitulate. As the bulls are back in control, the spot will focus on the 111.50 resistance to extend gains towards the 111.95 and 111.41 levels. Support can be seen near the 110.69, 110.34 and 109.88 levels, according to the Technical Confluences Indicator


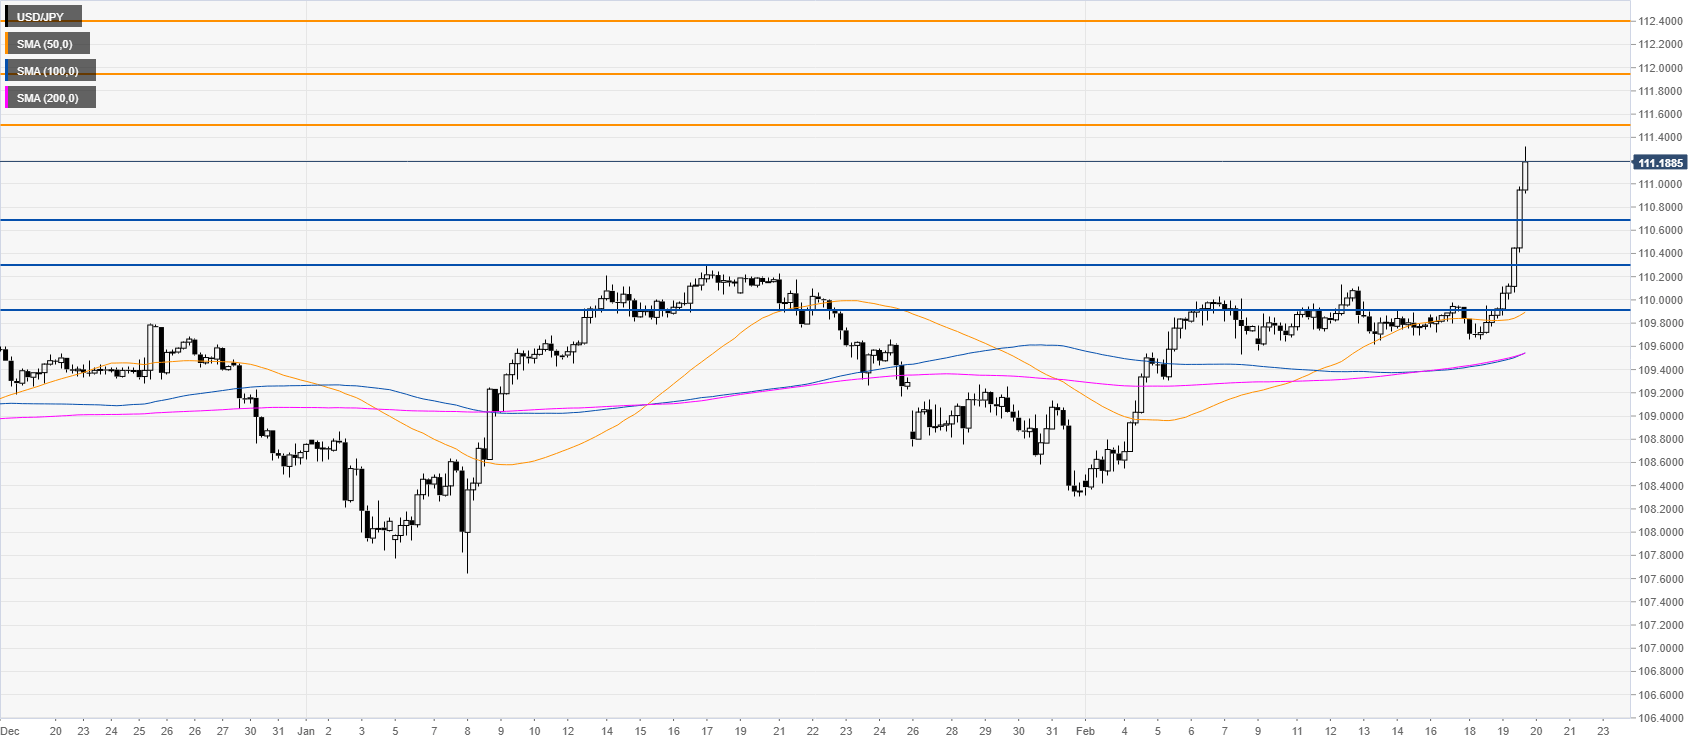
Resistance: 111.50, 111.95, 111.41
Support: 110.69, 110.34, 109.88


Additional key levels

USD/JPY

Overview
Today last price111.2
Today Daily Change1.34
Today Daily Change %1.22
Today daily open109.86
 
Trends
Daily SMA20109.48
Daily SMA50109.39
Daily SMA100108.98
Daily SMA200108.38
 
Levels
Previous Daily High109.95
Previous Daily Low109.66
Previous Weekly High110.14
Previous Weekly Low109.56
Previous Monthly High110.29
Previous Monthly Low107.65
Daily Fibonacci 38.2%109.77
Daily Fibonacci 61.8%109.84
Daily Pivot Point S1109.69
Daily Pivot Point S2109.53
Daily Pivot Point S3109.41
Daily Pivot Point R1109.98
Daily Pivot Point R2110.11
Daily Pivot Point R3110.27

Author

Flavio Tosti

Flavio Tosti

Independent Analyst


More from Flavio Tosti
Share:

Editor's Picks

EUR/USD climbs to daily highs near 1.1820

EUR/USD now picks up pace and advances to the area of daily peaks north of the 1.1800 barrier at the end of the week. The pair’s decent move higher comes against the backdrop of a generalised lack of direction in the FX galaxy and the mild offered stance in the US Dollar.

GBP/USD trims losses, retests 1.3460

After briefly challenging its key 200-day SMA near 1.3440, GBP/USD now manages to regain some balance and revisit the 1.3460 zone on Friday. Cable’s pullback comes as the selling pressure on the Greenback gathers traction, reigniting some recovery in the risk-linked space.

Gold flirts with four-week highs past $5,200

Gold extends its rebound, climbing for a third consecutive session and pushing back above the $5,200 mark per troy ounce on Friday. The move higher continues to draw support from lingering geopolitical tensions and the ongoing uncertainty surrounding US trade policy, both of which are keeping safe-haven demand firmly in play.

Bitcoin, Ethereum and Ripple consolidate with short-term cautious bullish bias

Bitcoin, Ethereum and Ripple are consolidating near key technical areas on Friday, showing mild signs of stabilization after recent volatility. BTC holds above $67,000 despite mild losses so far this week, while ETH hovers around $2,000 after a rejection near its upper consolidation boundary. 

Breaking: US and Israel attack Iran, risk aversion to sweep global markets

Early Saturday, United States (US) President Donald Trump announced that the US had begun “major combat operations” in Iran, following Israel’s pre-emptive missile attacks against Tehran.

Starknet unveils strkBTC, shielded Bitcoin transactions on Ethereum Layer 2

Starknet, the Ethereum Layer 2 network developed by StarkWare, today announced strkBTC, a wrapped Bitcoin asset that introduces optional shielding while preserving full DeFi composability.