|

USD/JPY Price Analysis: Declines to five-month low, trades near 140.80

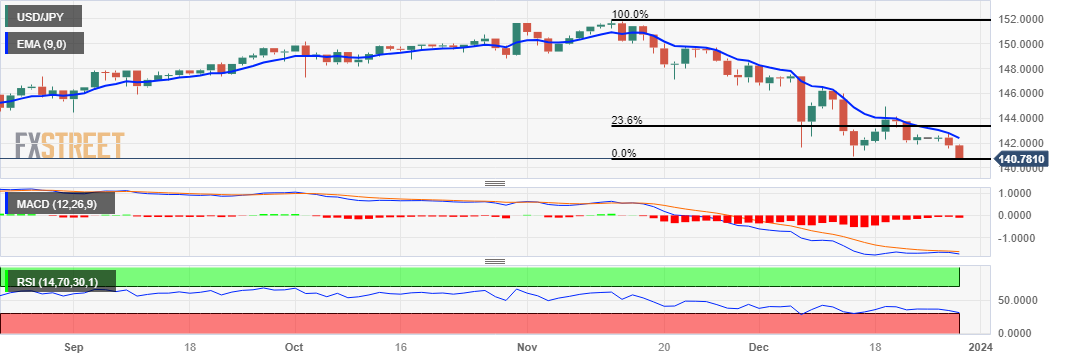
  • USD/JPY moves below the 141.00 psychological level on the back of the subdued US Dollar.
  • A firm break above the 142.00 level could lead the pair to reach a nine-day EMA at 142.41.
  • Technical indicators suggest a bearish sentiment to test the major support at 140.50.

USD/JPY extends its losses as the US Dollar (USD) weakens on the back of the dovish Federal Reserve’s (Fed) outlook in the first quarter of 2024. The USD/JPY pair trades lower around 140.80 during the early European session on Thursday. The 141.00 psychological level emerges as the immediate resistance following the next barrier at the 142.00 level.

if there is a breakthrough above the psychological level, it may support the USD/JPY pair to reach the nine-day Exponential Moving Average (EMA) at 142.41, following the psychological resistance at the 143.00 level. If the pair successfully surpasses this level, the next barrier would be the 23.6% Fibonacci retracement level at 143.35.

The 14-day Relative Strength Index (RSI) below the 50 level indicates a weaker sentiment for the USD/JPY pair. Additionally, the Moving Average Convergence Divergence (MACD) line is positioned below the centerline and the signal line, signaling a bearish momentum in the market for the USD/JPY pair.

The bearish sentiment could potentially lead the USD/JPY pair towards the major support region around 140.50. If there is a decisive break below this level, it may open the door for the pair to test the psychological level at 140.00.

USD/JPY: Daily Chart

USD/JPY: additional technical levels to watch

Overview
Today last price140.82
Today Daily Change-0.99
Today Daily Change %-0.70
Today daily open141.81
 
Trends
Daily SMA20144.32
Daily SMA50147.69
Daily SMA100147.63
Daily SMA200142.93
 
Levels
Previous Daily High142.85
Previous Daily Low141.55
Previous Weekly High144.96
Previous Weekly Low141.86
Previous Monthly High151.91
Previous Monthly Low146.67
Daily Fibonacci 38.2%142.05
Daily Fibonacci 61.8%142.35
Daily Pivot Point S1141.29
Daily Pivot Point S2140.77
Daily Pivot Point S3139.99
Daily Pivot Point R1142.59
Daily Pivot Point R2143.37
Daily Pivot Point R3143.89

Author

Akhtar Faruqui

Akhtar Faruqui is a Forex Analyst based in New Delhi, India. With a keen eye for market trends and a passion for dissecting complex financial dynamics, he is dedicated to delivering accurate and insightful Forex news and analysis.

More from Akhtar Faruqui
Share:

Markets move fast. We move first.

Orange Juice Newsletter brings you expert driven insights - not headlines. Every day on your inbox.

By subscribing you agree to our Terms and conditions.

Editor's Picks

EUR/USD bounces toward 1.1750 as US Dollar loses strength

EUR/USD returned to the 1.1750 price zone in the American session on Friday, despite falling Wall Street, which indicates risk aversion. Trading conditions remain thin following the New Year holiday and ahead of the weekend, with the focus shifting to US employment and European data scheduled for next week.

GBP/USD nears 1.3500, holds within familiar levels

After testing 1.3400 on the last day of 2025, GBP/USD managed to stage a rebound. Nevertheless, the pair finds it difficult to gather momentum and trades with modest intraday gains at around 1.3490 as market participants remain in holiday mood.

Gold trims intraday gains, approaches $4,300

Gold retreated sharply from the $4,400  area and trades flat for the day in the $4,320 price zone. Choppy trading conditions exacerbated the intraday decline, although XAU/USD bearish case is out of the picture, considering growing expectations for a dovish Fed and persistent geopolitical tensions.

Breaking: US Trump strikes Venezuela, claims President Maduro was captured and flown out of the country

United States (US) President Donald Trump has fulfilled his threats and finally struck Venezuela. Different media reports that explosions in Caracas began around 1:50 am local time on Saturday, leaving multiple areas of the city without power.

Economic outlook 2026-2027 in advanced countries: Solidity test

After a year marked by global economic resilience and ending on a note of optimism, 2026 looks promising and could be a year of solid economic performance. In our baseline scenario, we expect most of the supportive factors at work in 2025 to continue to play a role in 2026.

Crypto market outlook for 2026

Year 2025 was volatile, as crypto often is.  Among positive catalysts were favourable regulatory changes in the U.S., rise of Digital Asset Treasuries (DAT), adoption of AI and tokenization of Real-World-Assets (RWA).