|

USD/JPY Price Analysis: Consolidates before Fed’s decision

  • USD/JPY will remain subdued as traders await the US Federal Reserve.
  • Caution is warranted, given the fact that oscillators are giving mixed signals.
  • USD/JPY Price Analysis: Short-term, a bearish continuation is likely; otherwise, buyers can reclaim 133.00.

USD/JPY remains in choppy trading price action, with investors eyeing Wednesday’s US Federal Reserve decision. At the time of typing, the USD/JPY pair exchanges hands at around 132.50s after traveling from a daily low of 132.25 and hitting a high at 133.00.

USD/JPY Price action

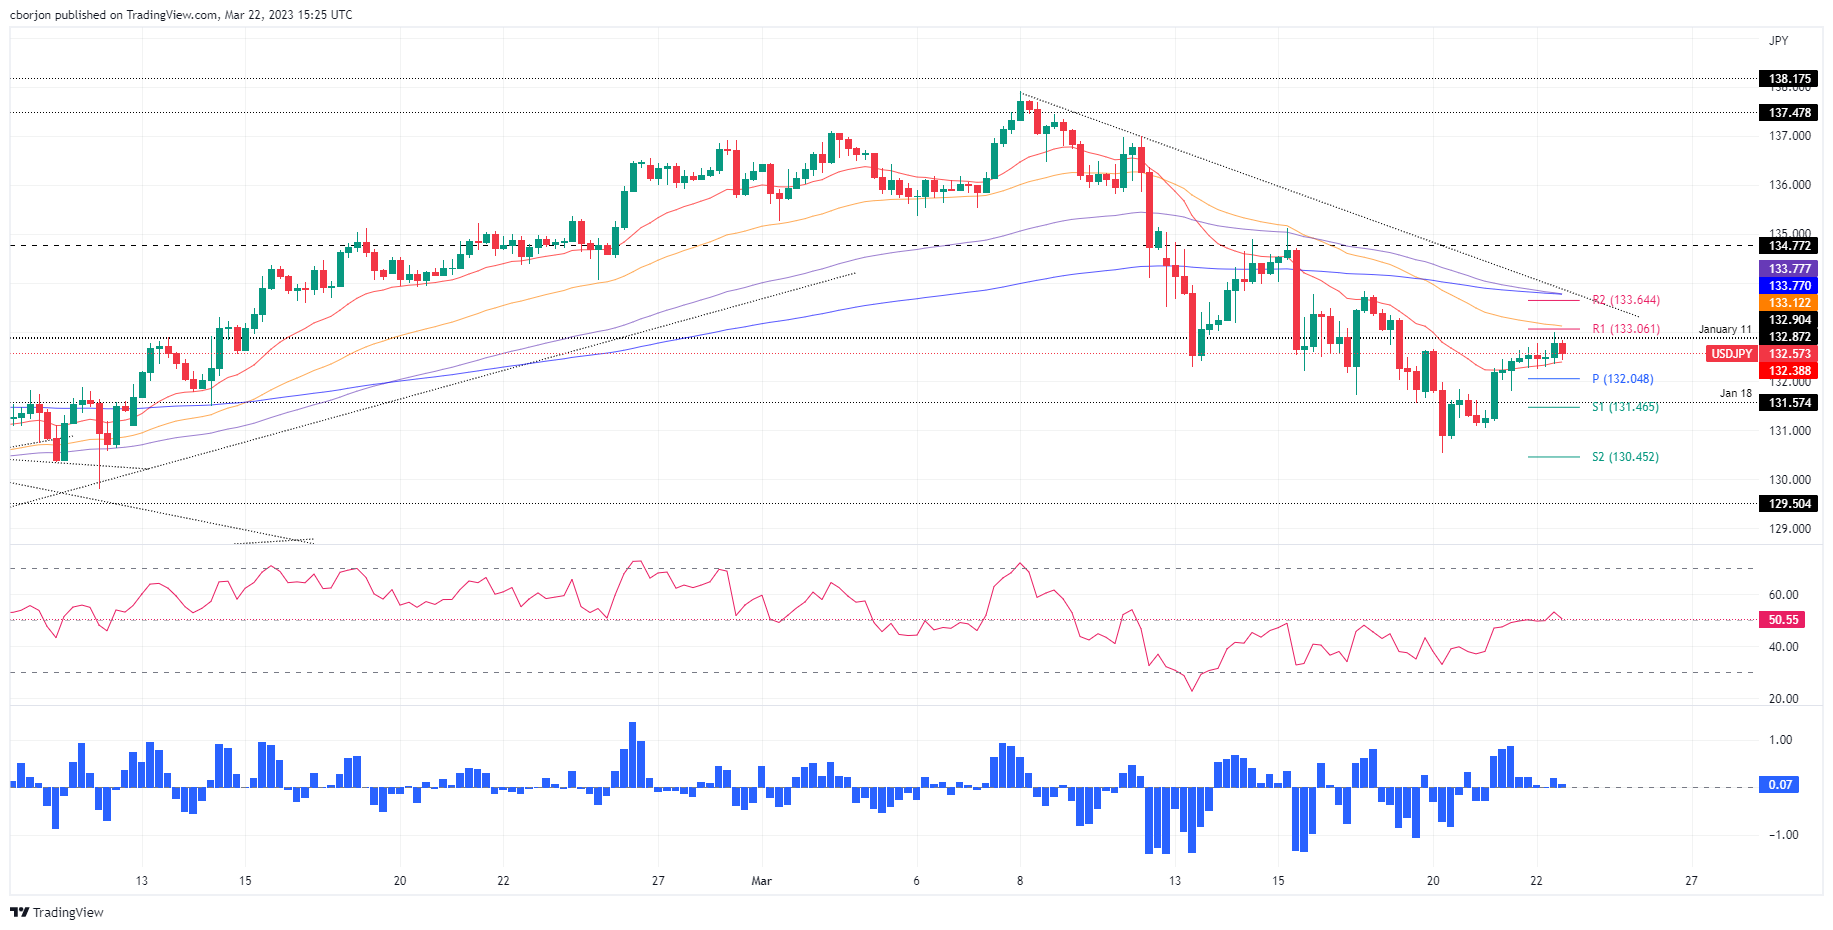
The USD/JPY pair trades nearby the weekly highs, though it remains sideways. The Exponential Moving Averages (EMAs) in the daily chart turned flat, while oscillators like the Relative Strength Index (RSI) and the Rate of Change (RoC) give mixed signals.

In the short-term, the USD/JPY 4-hour chat paints the pair as downward biased, trading below the 50, 100, and 200-EMAs. Also, a three-week-old downslope resistance trendline would cap any rallies should the USD/JPY exceed the 133.50 area.

For a bearish continuation, the USD/JPY is backed by oscillators, like the RSI is about to turn bearish, while the RoC portrays buying pressure waning. That said, the USD/JPY first support would be the 20-EMA at 132.38. A breach of the latter could send the pair to the daily pivot at 132.04, followed by a drop to the S1 pivot point at 131.46. Once cleared, the USD/JPY would challenge the 131.00 figure.

In an alternate scenario, the USD/JPY first resistance would be the R1 pivot at 133.06. Once broken, the pair would immediately test the 50-EMA at 133.11, followed by the R2 daily pivot point at 133.64, ahead of the confluence of the 100/200-EMAs at 133.76/77.

USD/JPY 4-hour chart

USD/JPY 4-hour chart

USD/JPY Technical levels

USD/JPY

Overview
Today last price132.6
Today Daily Change0.09
Today Daily Change %0.07
Today daily open132.51
 
Trends
Daily SMA20134.93
Daily SMA50132.53
Daily SMA100134.95
Daily SMA200137.45
 
Levels
Previous Daily High132.63
Previous Daily Low131.04
Previous Weekly High135.12
Previous Weekly Low131.56
Previous Monthly High136.92
Previous Monthly Low128.08
Daily Fibonacci 38.2%132.02
Daily Fibonacci 61.8%131.64
Daily Pivot Point S1131.49
Daily Pivot Point S2130.47
Daily Pivot Point S3129.9
Daily Pivot Point R1133.08
Daily Pivot Point R2133.65
Daily Pivot Point R3134.67

Author

Christian Borjon Valencia

Christian Borjon began his career as a retail trader in 2010, mainly focused on technical analysis and strategies around it. He started as a swing trader, as he used to work in another industry unrelated to the financial markets.

More from Christian Borjon Valencia
Share:

Markets move fast. We move first.

Orange Juice Newsletter brings you expert driven insights - not headlines. Every day on your inbox.

By subscribing you agree to our Terms and conditions.

Editor's Picks

EUR/USD bounces toward 1.1750 as US Dollar loses strength

EUR/USD returned to the 1.1750 price zone in the American session on Friday, despite falling Wall Street, which indicates risk aversion. Trading conditions remain thin following the New Year holiday and ahead of the weekend, with the focus shifting to US employment and European data scheduled for next week.

GBP/USD nears 1.3500, holds within familiar levels

After testing 1.3400 on the last day of 2025, GBP/USD managed to stage a rebound. Nevertheless, the pair finds it difficult to gather momentum and trades with modest intraday gains at around 1.3490 as market participants remain in holiday mood.

Gold trims intraday gains, approaches $4,300

Gold retreated sharply from the $4,400  area and trades flat for the day in the $4,320 price zone. Choppy trading conditions exacerbated the intraday decline, although XAU/USD bearish case is out of the picture, considering growing expectations for a dovish Fed and persistent geopolitical tensions.

Cardano gains early New Year momentum, bulls target falling wedge breakout

Cardano kicks off the New Year on a positive note and is extending gains, trading above $0.36 at the time of writing on Friday. Improving on-chain and derivatives data point to growing bullish interest, while the technical outlook keeps an upside breakout in focus.

Economic outlook 2026-2027 in advanced countries: Solidity test

After a year marked by global economic resilience and ending on a note of optimism, 2026 looks promising and could be a year of solid economic performance. In our baseline scenario, we expect most of the supportive factors at work in 2025 to continue to play a role in 2026.

Crypto market outlook for 2026

Year 2025 was volatile, as crypto often is.  Among positive catalysts were favourable regulatory changes in the U.S., rise of Digital Asset Treasuries (DAT), adoption of AI and tokenization of Real-World-Assets (RWA).