- USD/JPY climbs above 156.50 as buyers push prices above Ichimoku Cloud.
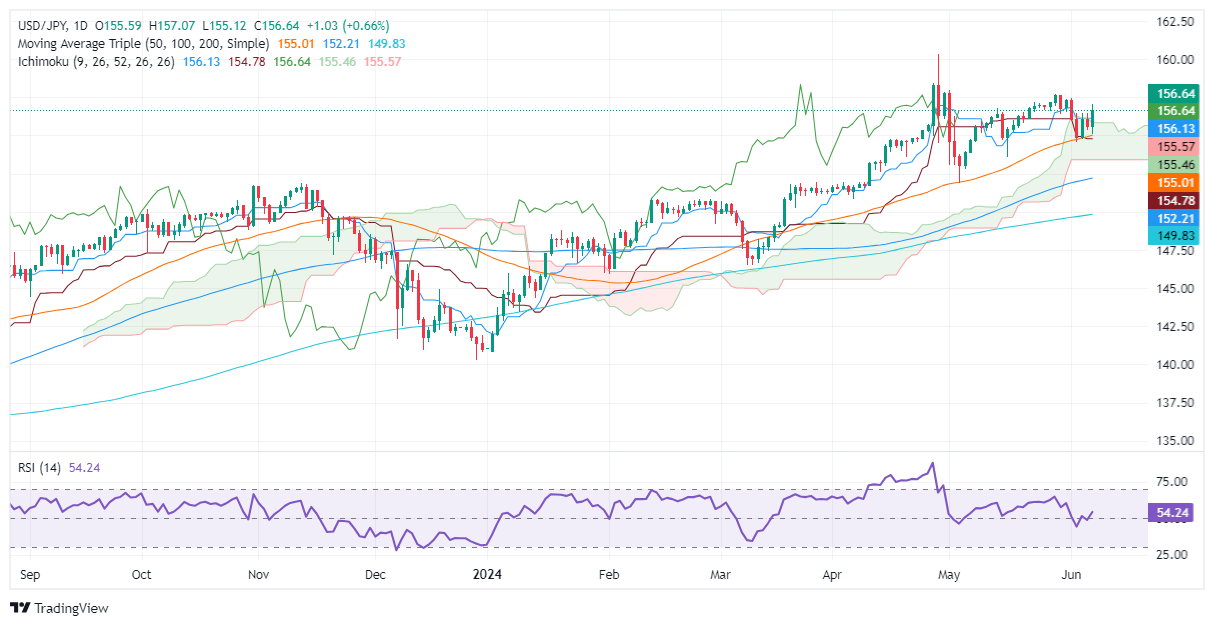
- Resistance at June 4 high (156.48), 157.00, April 26 high (158.44), and YTD high (160.32).
- Supports at Senkou Span A and B (155.52/45), 50-DMA (154.98), and Ichimoku Cloud base (153.40/50).
The USD/JPY registered modest gains of 0.66% on Friday after a stronger-than-expected US employment report, which decreased the chances that the US Federal Reserve could ease policy during the year. Therefore, the pair trades at 156.64 after bouncing off lows of 155.12.
USD/JPY Price Analysis: Technical outlook
From a daily chart perspective, the USD/JPY continues to remain consolidated, slightly tilted to the upside. The pair climbed above the Ichimoku Cloud (Kumo), an indication of buyers' strength.
Momentum turned bullish, yet the pair could see an increase in volatility due to threats of intervention by Japanese authorities.
Once the USD/JPY cleared the June 4 high of 156.48, that could sponsor a leg-up toward 157.00. On further strength, the next supply zone would be the April 26 high of 158.44, followed by the year-to-date (YTD) high of 160.32.
Conversely, if USD/JPY tumbles below 156.00, the first support would be the confluence of the Senkou Span A and B at around 155.52/45, before testing the 50-day moving average (DMA) at 154.98. A breach of the latter will expose the bottom of the Ichimoku Cloud (Kumo) at around 153.40/50.
USD/JPY Price Action – Daily Chart
Japanese Yen PRICE Today
The table below shows the percentage change of Japanese Yen (JPY) against listed major currencies today. Japanese Yen was the strongest against the New Zealand Dollar.
USD | EUR | GBP | JPY | CAD | AUD | NZD | CHF | |
---|---|---|---|---|---|---|---|---|
USD | 0.82% | 0.53% | 0.67% | 0.62% | 1.27% | 1.47% | 0.81% | |
EUR | -0.82% | -0.27% | -0.14% | -0.19% | 0.46% | 0.72% | 0.01% | |
GBP | -0.53% | 0.27% | 0.14% | 0.08% | 0.74% | 0.99% | 0.27% | |
JPY | -0.67% | 0.14% | -0.14% | -0.05% | 0.59% | 0.81% | 0.15% | |
CAD | -0.62% | 0.19% | -0.08% | 0.05% | 0.65% | 0.92% | 0.19% | |
AUD | -1.27% | -0.46% | -0.74% | -0.59% | -0.65% | 0.25% | -0.48% | |
NZD | -1.47% | -0.72% | -0.99% | -0.81% | -0.92% | -0.25% | -0.71% | |
CHF | -0.81% | -0.01% | -0.27% | -0.15% | -0.19% | 0.48% | 0.71% |
The heat map shows percentage changes of major currencies against each other. The base currency is picked from the left column, while the quote currency is picked from the top row. For example, if you pick the Japanese Yen from the left column and move along the horizontal line to the US Dollar, the percentage change displayed in the box will represent JPY (base)/USD (quote).
Information on these pages contains forward-looking statements that involve risks and uncertainties. Markets and instruments profiled on this page are for informational purposes only and should not in any way come across as a recommendation to buy or sell in these assets. You should do your own thorough research before making any investment decisions. FXStreet does not in any way guarantee that this information is free from mistakes, errors, or material misstatements. It also does not guarantee that this information is of a timely nature. Investing in Open Markets involves a great deal of risk, including the loss of all or a portion of your investment, as well as emotional distress. All risks, losses and costs associated with investing, including total loss of principal, are your responsibility. The views and opinions expressed in this article are those of the authors and do not necessarily reflect the official policy or position of FXStreet nor its advertisers. The author will not be held responsible for information that is found at the end of links posted on this page.
If not otherwise explicitly mentioned in the body of the article, at the time of writing, the author has no position in any stock mentioned in this article and no business relationship with any company mentioned. The author has not received compensation for writing this article, other than from FXStreet.
FXStreet and the author do not provide personalized recommendations. The author makes no representations as to the accuracy, completeness, or suitability of this information. FXStreet and the author will not be liable for any errors, omissions or any losses, injuries or damages arising from this information and its display or use. Errors and omissions excepted.
The author and FXStreet are not registered investment advisors and nothing in this article is intended to be investment advice.
Recommended content
Editors’ Picks

GBP/USD treads water near 1.2950 ahead of UK data
GBP/USD holds steady near 1.2950 in Friday's European trading hours. Uncertainty over US President Trump's tariff plans dominate and weigh on the risk-sensitive currency pair as traders look to top-tier UK and US data for fresh trading impetus.

Gold price retains bullish bias near record high as trade tensions boosts safe-haven demand
Gold price continues to attract safe-haven flows amid rising trade tensions. Fed rate cut bets keep the USD bulls on the defensive and also lend support. Traders now look to the US PCE Price Index for some meaningful impetus.

EUR/USD trades with mild losses below 1.0800, awaits US PCE
EUR/USD is on the back foot below 1.0800 early Friday, struggling to capitalize on the previous day's goodish bounce. Trump's tariff jitters keep investors on the edge, leaving the pair gyrating in a range ahead of the key US PCE inflation data.

Bitcoin stabilizes while Ethereum and Ripple show weakness
Bitcoin price stabilizes at around $87,000 on Friday, as its RSI indicates indecisiveness among traders. However, Ethereum and Ripple show signs of weakness as they face resistance around their key levels and face a pullback this week.

US: Trump's 'Liberation day' – What to expect?
Trump has so far enacted tariff changes that have lifted the trade-weighted average tariff rate on all US imports by around 5.5-6.0%-points. While re-rerouting of trade will decrease the effectiveness of tariffs over time, the current level is already close to the highest since the second world war.

The Best brokers to trade EUR/USD
SPONSORED Discover the top brokers for trading EUR/USD in 2025. Our list features brokers with competitive spreads, fast execution, and powerful platforms. Whether you're a beginner or an expert, find the right partner to navigate the dynamic Forex market.